vanna exposure
How delta responds to implied volatility, and gexbot's -vanna ex convention.
Rather than measuring how delta changes with respect to the price of the underlying, vanna measures the rate of change of delta with respect to increases in implied volatility (IV). IV expresses options prices normalized for time to expiration. Instead of referring to price in dollar terms, IV refers to the move in underlying price implied by the option price, independent of direction.
By convention this is expressed in terms of an annualized 1 standard deviation move. For example, an at-the-money IV of 20% on an underlying valued at $100 means that the option price implies a range of $20 above or below current prices over the course of the next 365 days. Just like options prices, implied volatilities change as traders' expectations do.
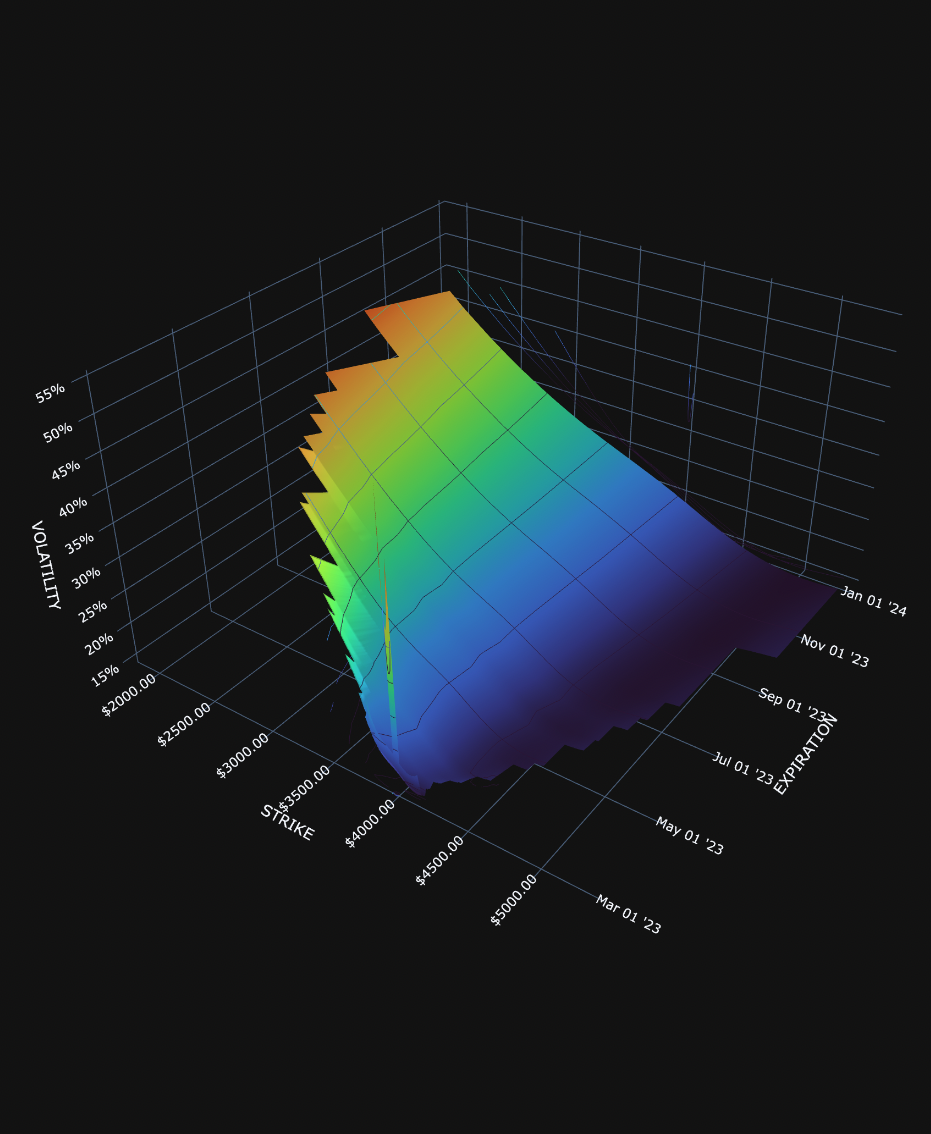
It can be especially helpful to think about increases and decreases in implied volatility as increases or decreases in time to expiration. The power of vanna becomes clear with a simple thought experiment that leverages this insight: What happens to the probability of expiring ITM, and hence the delta of an option as we give it more (less) time until expiration? You can test your intuition with the table below.
You'll notice that adding more time lowers the probability that ITM options will stay ITM, hence lowering the absolute value of their delta. The opposite is the case for OTM options. Giving an OTM option more time increases the probability that it will expire ITM. Now that we have this intuition, vanna follows. As vanna is defined as the change in delta for a 1% increase in IV, we only care about the case of increasing IV and must factor in the sign of the delta (positive for calls and negative for puts). The end result is that, irrespective of option type, vanna is positive above spot and negative below!
So what about vanna exposure? For each strike, 100 × vanna × OI would tell us how many shares we would need to hedge a 1 point move up in IV (e.g. from 20% to 21%). Then, to get the capital required for that hedge, we would further multiply by spot price. There is an embedded assumption here. Who is to say that all strike IVs will increase in lockstep? This is seldom the case. In fact, for a given day, we know that 0DTE option IVs will collapse to 0, while 1DTE option IVs will likely increase slightly.
This is where gexbot breaks with convention. Because our focus is on short-dated options, we use vanna to model the capital required to hedge IV going to 0: What would the impact be every contract were to expire? Accordingly, we convert the 1 point increase in IV to a total collapse in IV, by multiplying by each strike's current IV × -1. Our axis therefore reads "-vanna ex". This is an approximation, but a consistent one.
Vanna may be positive above spot and negative below for long options, but the opposite is true for short options. Once these are netted out we get a clean visualization of vanna exposure at each strike. Netting out the whole chain for an expiry approximates the capital required to hedge a total collapse in IV at all strikes (net vex).
The upside of this method is that the result is simple and intuitive. We can directly compare its magnitude to the dex and gex of a given day, bringing the impact of volatility/time into perspective. The downside of this method is that the vanna exposure of each expiry is specific to that expiry. "-vanna ex" for 0DTE refers to the impact of expiry today, whereas "-vanna ex" for 1DTE refers to the impact of expiry tomorrow. This deficiency, however, is a segue to charm.