gexbot classic
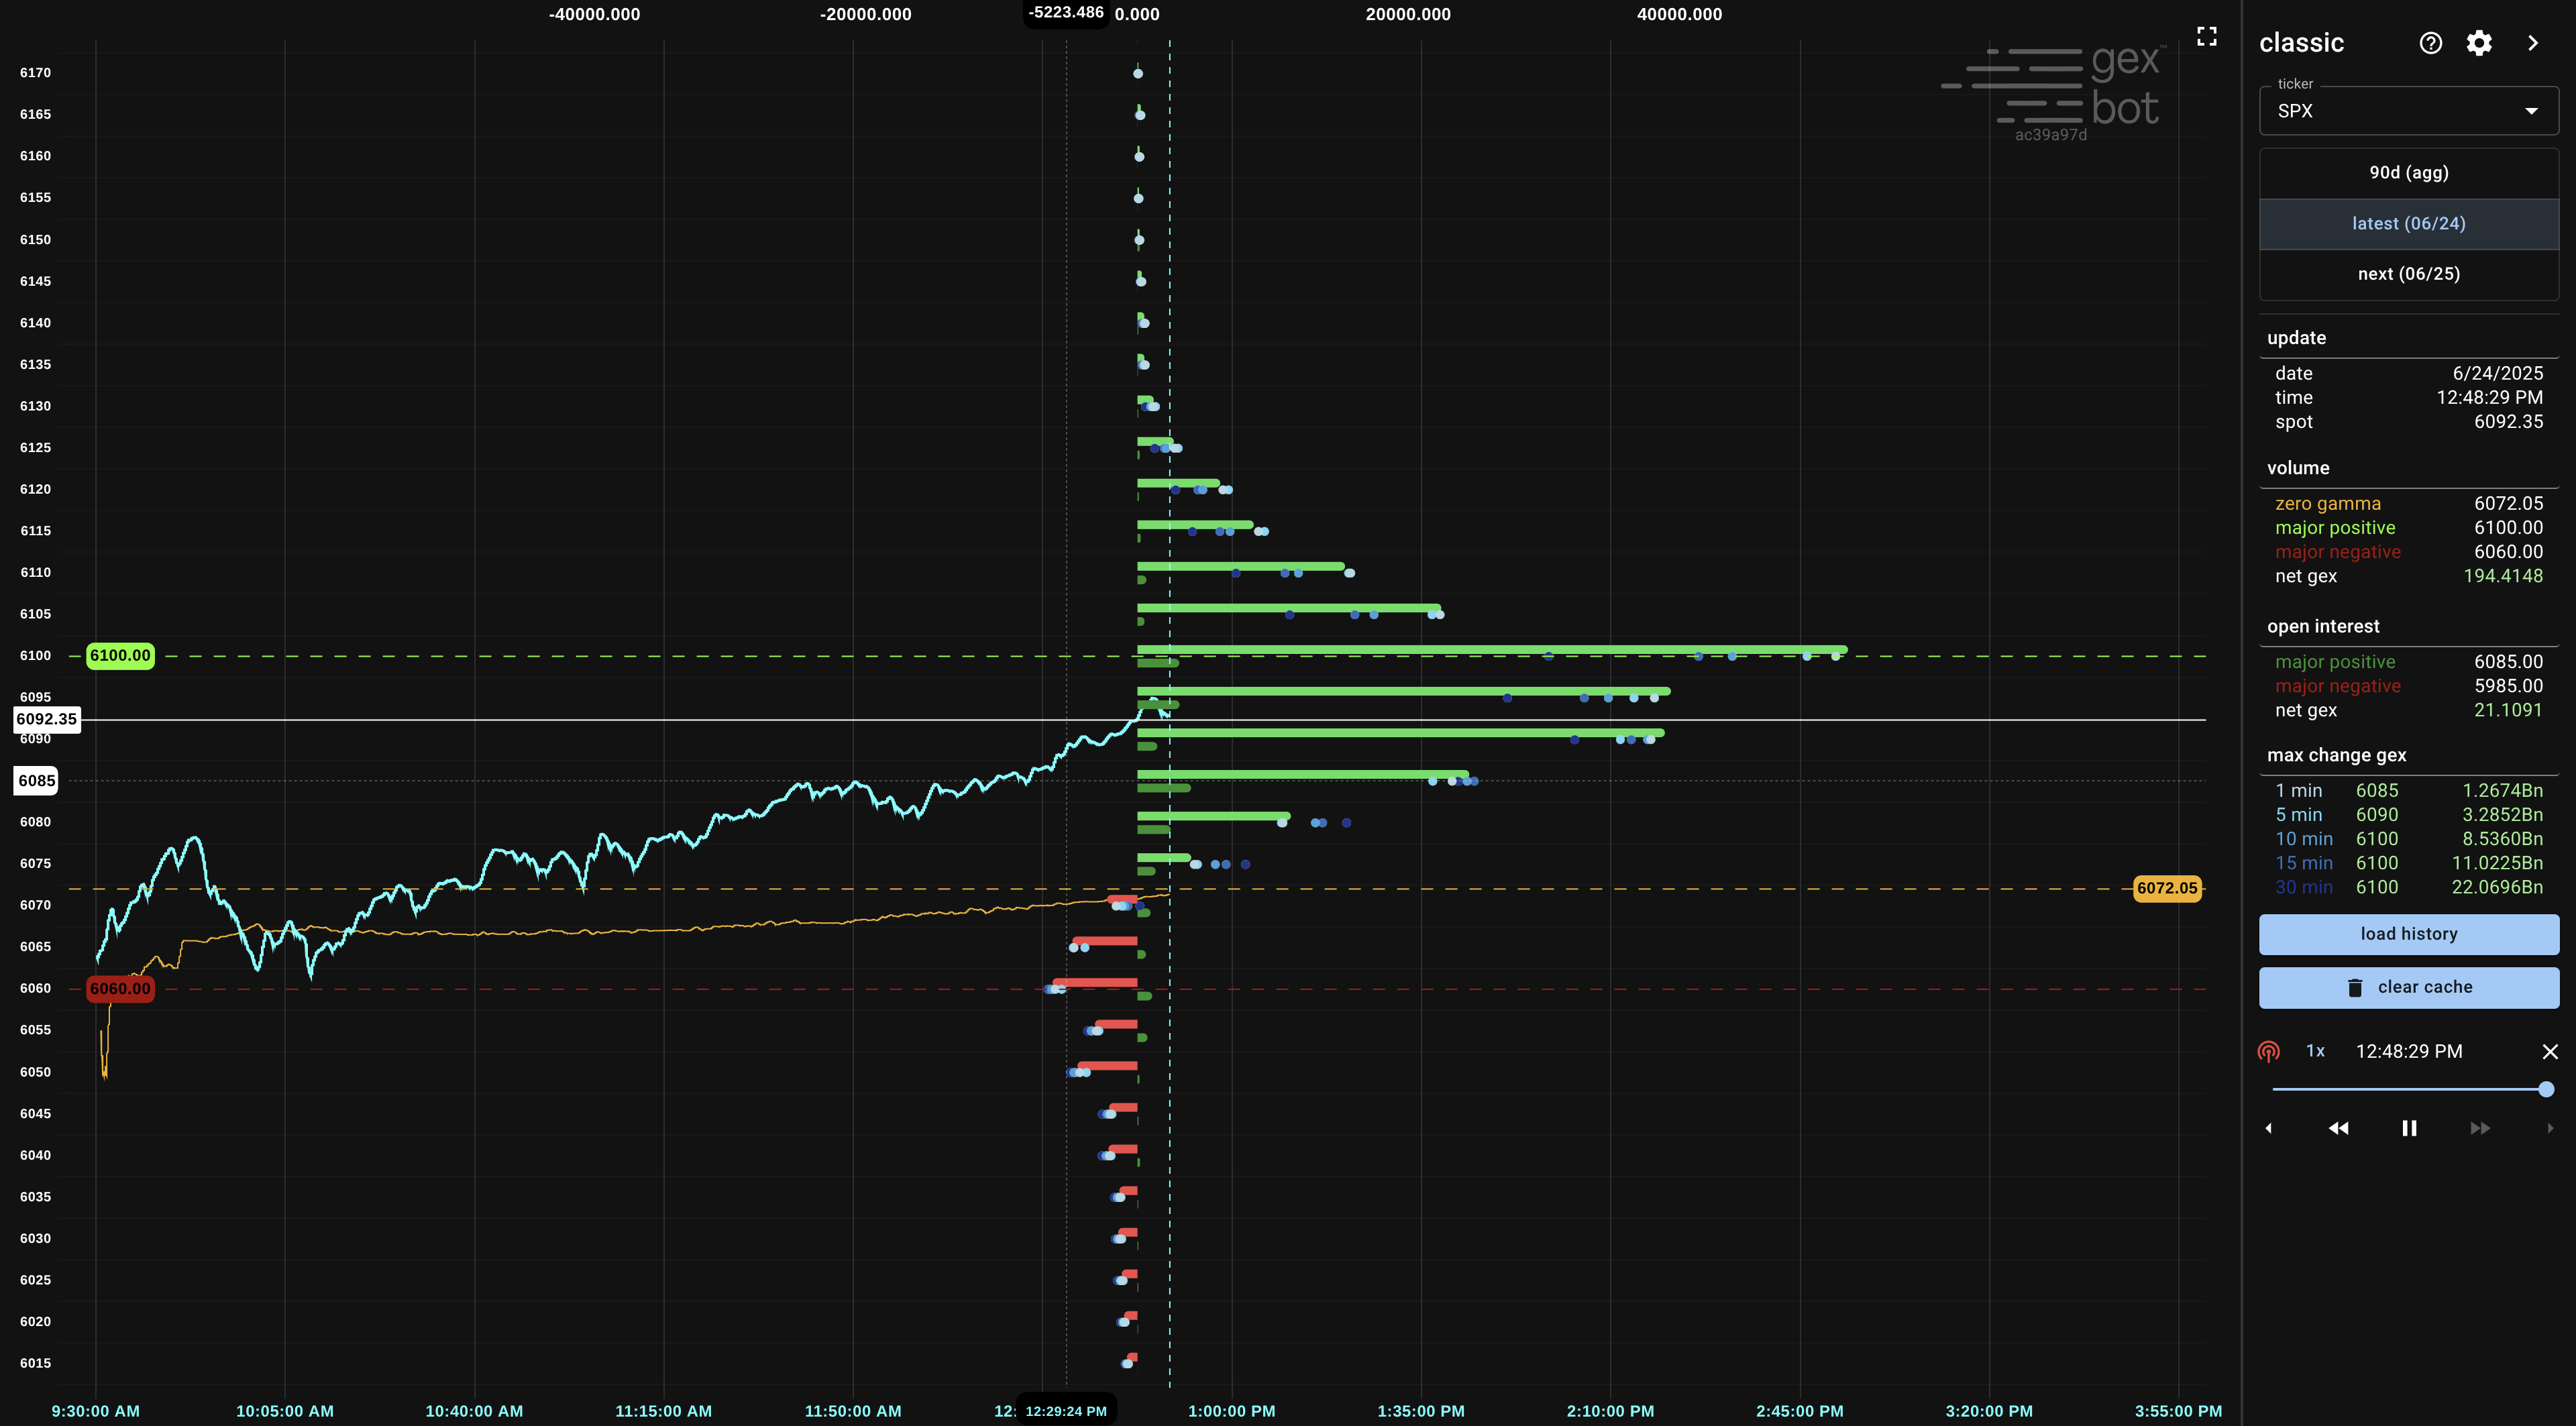
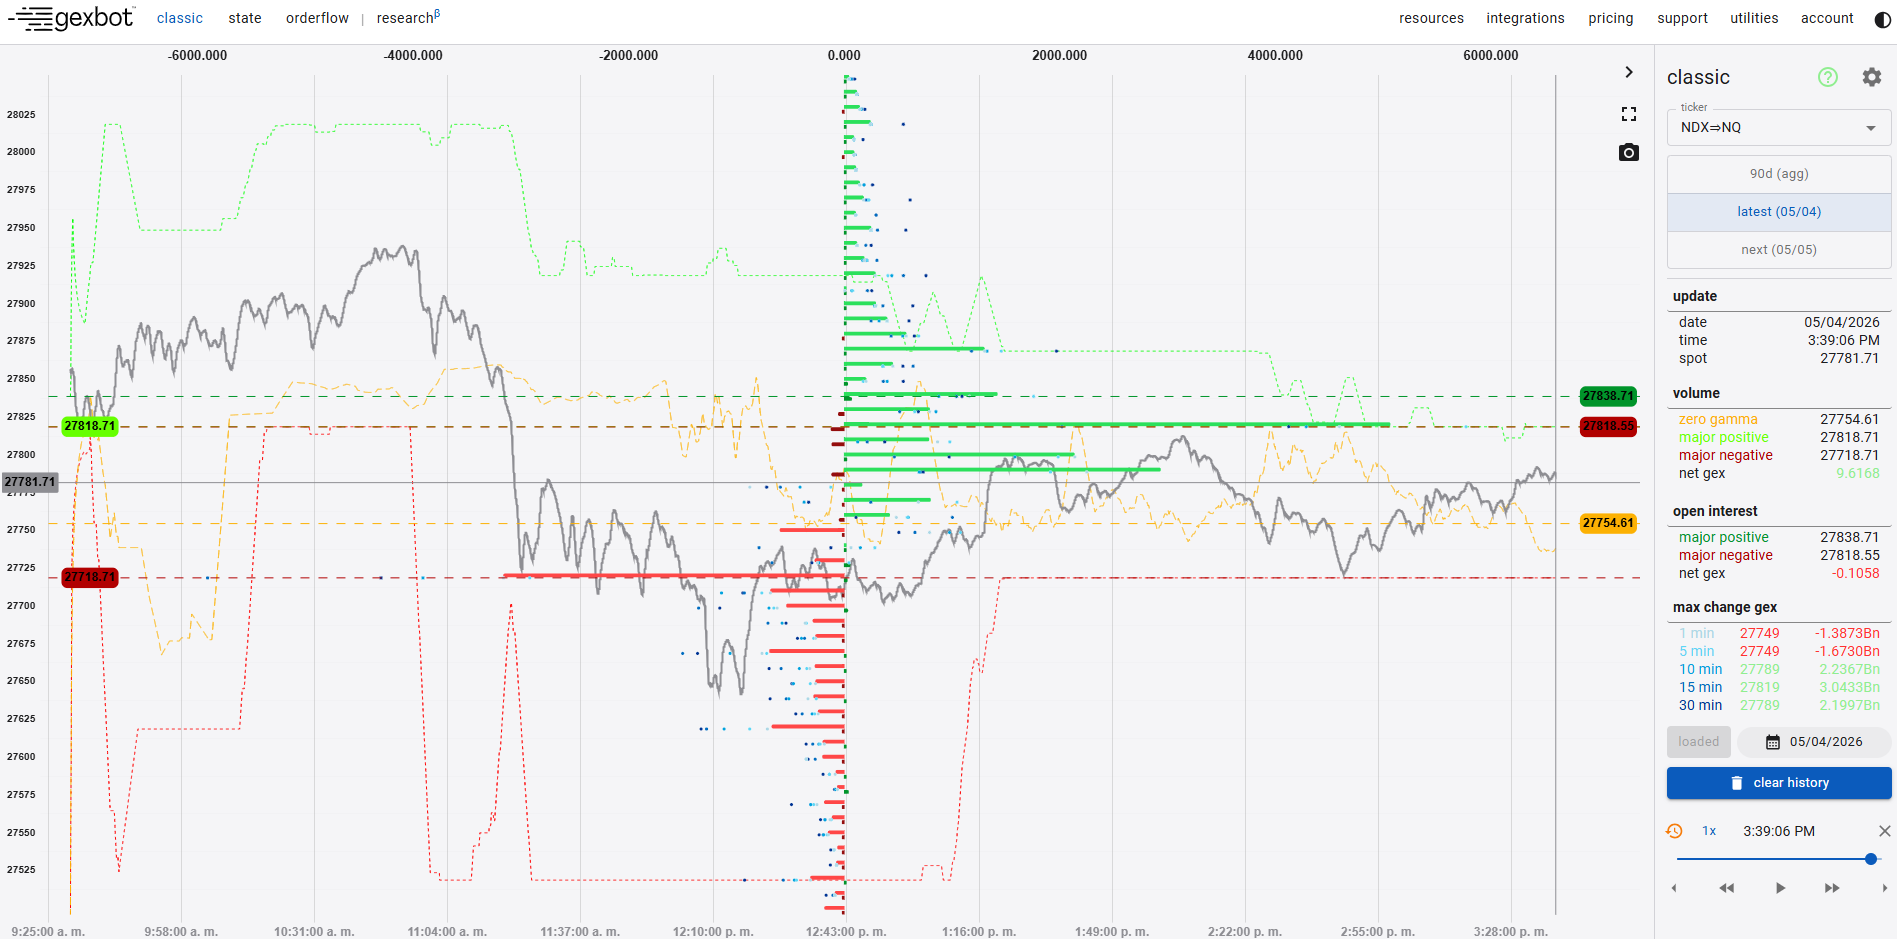
GEX by Open Interest and Volume in a ladder-style histogram with calculated major levels, lookback dots, and real-time streaming updates.
API Endpoints
Access programmatic Classic data via the Classic Chain API, Major Levels API, and Max Change API.
gexbot Classic visualizes Gamma Exposure (GEX) by Open Interest and Volume in a horizontal ladder histogram.
Axes and Orientation
- Vertical Y-Axis: Displays strike prices.
- Horizontal X-Axis: Displays net Gamma Exposure magnitude.
- Fixed Orientation: The ladder orientation is fixed horizontally. You cannot rotate the axes.
For every strike:
- Call GEX extends to the right (positive gamma).
- Put GEX extends to the left (negative gamma).
- Netting resolves opposing exposures to show whether the options complex accelerates or dampens price action.
Core Calculations
GEX by volume is used to calculate:
- Zero Gamma: The equilibrium boundary of the options complex.
- Major Positive Gamma: The positive GEX strike of greatest magnitude (primary resistance or deceleration zone).
- Major Negative Gamma: The negative GEX strike of greatest magnitude (acceleration trigger or support boundary).
- Max Change Strikes: The strikes with the largest GEX shifts over 1, 5, 10, 15, and 30-minute lookback windows.
Independent Calculation of Majors
Major Positive Gamma and Major Negative Gamma are calculated independently. If both levels share the same strike, they do not have equal size. Each level reflects the single largest magnitude in its respective positive or negative pool.
A dedicated side panel also displays Zero Gamma, Major Positive Gamma, and Major Negative Gamma calculated by Open Interest (OI).
Automatic Unit Scaling: Large index symbols (SPX, NDX, ES_SPX, NQ_NDX) scale in Billions ($Bn). Single equities scale in Millions ($MM).
Expiration Horizons
The sidebar tab toggle formats session expiration dates dynamically:
- full (90d): Aggregates option expirations within the next 90 calendar days for macro structural analysis.
- latest (0 DTE): Isolates contracts expiring in the current session (
latest MM/DD) for intraday scalping. - next (1 DTE): Isolates contracts expiring in the following session (
next MM/DD) to assess overnight hedging.
Real-Time Streaming & History
- Open Interest Contract Refresh: Clearinghouse open interest counts refresh daily by 8:30 AM ET. GEX by Open Interest recalculates continuously as spot price and volatility change.
- Real-Time Streaming: Spot prices and volume calculations stream live between 9:30 AM and 4:00 PM ET.
- Lookback Dots: Embedded dots show strike GEX levels from 1, 5, 10, 15, and 30 minutes prior.
- Intraday History Slider: Scrub across any timestamp of the current session using the playbar.
- 90-Day Archive & Playback: Inspect past trading sessions for any supported ticker. Playback restores volume bars and calculated major levels across the session timeline.
- Synthetic Futures Notice: A banner warns when custom price conversion is active on synthetic pairs.
First-Run Walkthrough (Login to SPX)
Follow these steps to view your first chart:
- Log in to your account at gexbot.com.
- Select Classic in the top navigation bar.
- Enter
SPXinto the symbol input field in the sidebar. - Select an expiration horizon: click latest (0 DTE) for the current session or full (90d) for the combined chain.
- Locate the key levels on the ladder:
- Major Positive Gamma: The green level showing the primary resistance zone.
- Major Negative Gamma: The red level showing the primary support or acceleration boundary.
- Zero Gamma: The yellow or white level showing the volatility regime pivot.
Getting Started & Resources
- In-App Tutorial: Click the tutorial icon in the navigation bar to start an interactive tour.
- Logged-Out Demo: Visit the Classic card on gexbot.com to test an interactive demo without logging in.
- Discord Community: Join the gexbot Discord for automated chart alerts, bot commands, and trader discussion.
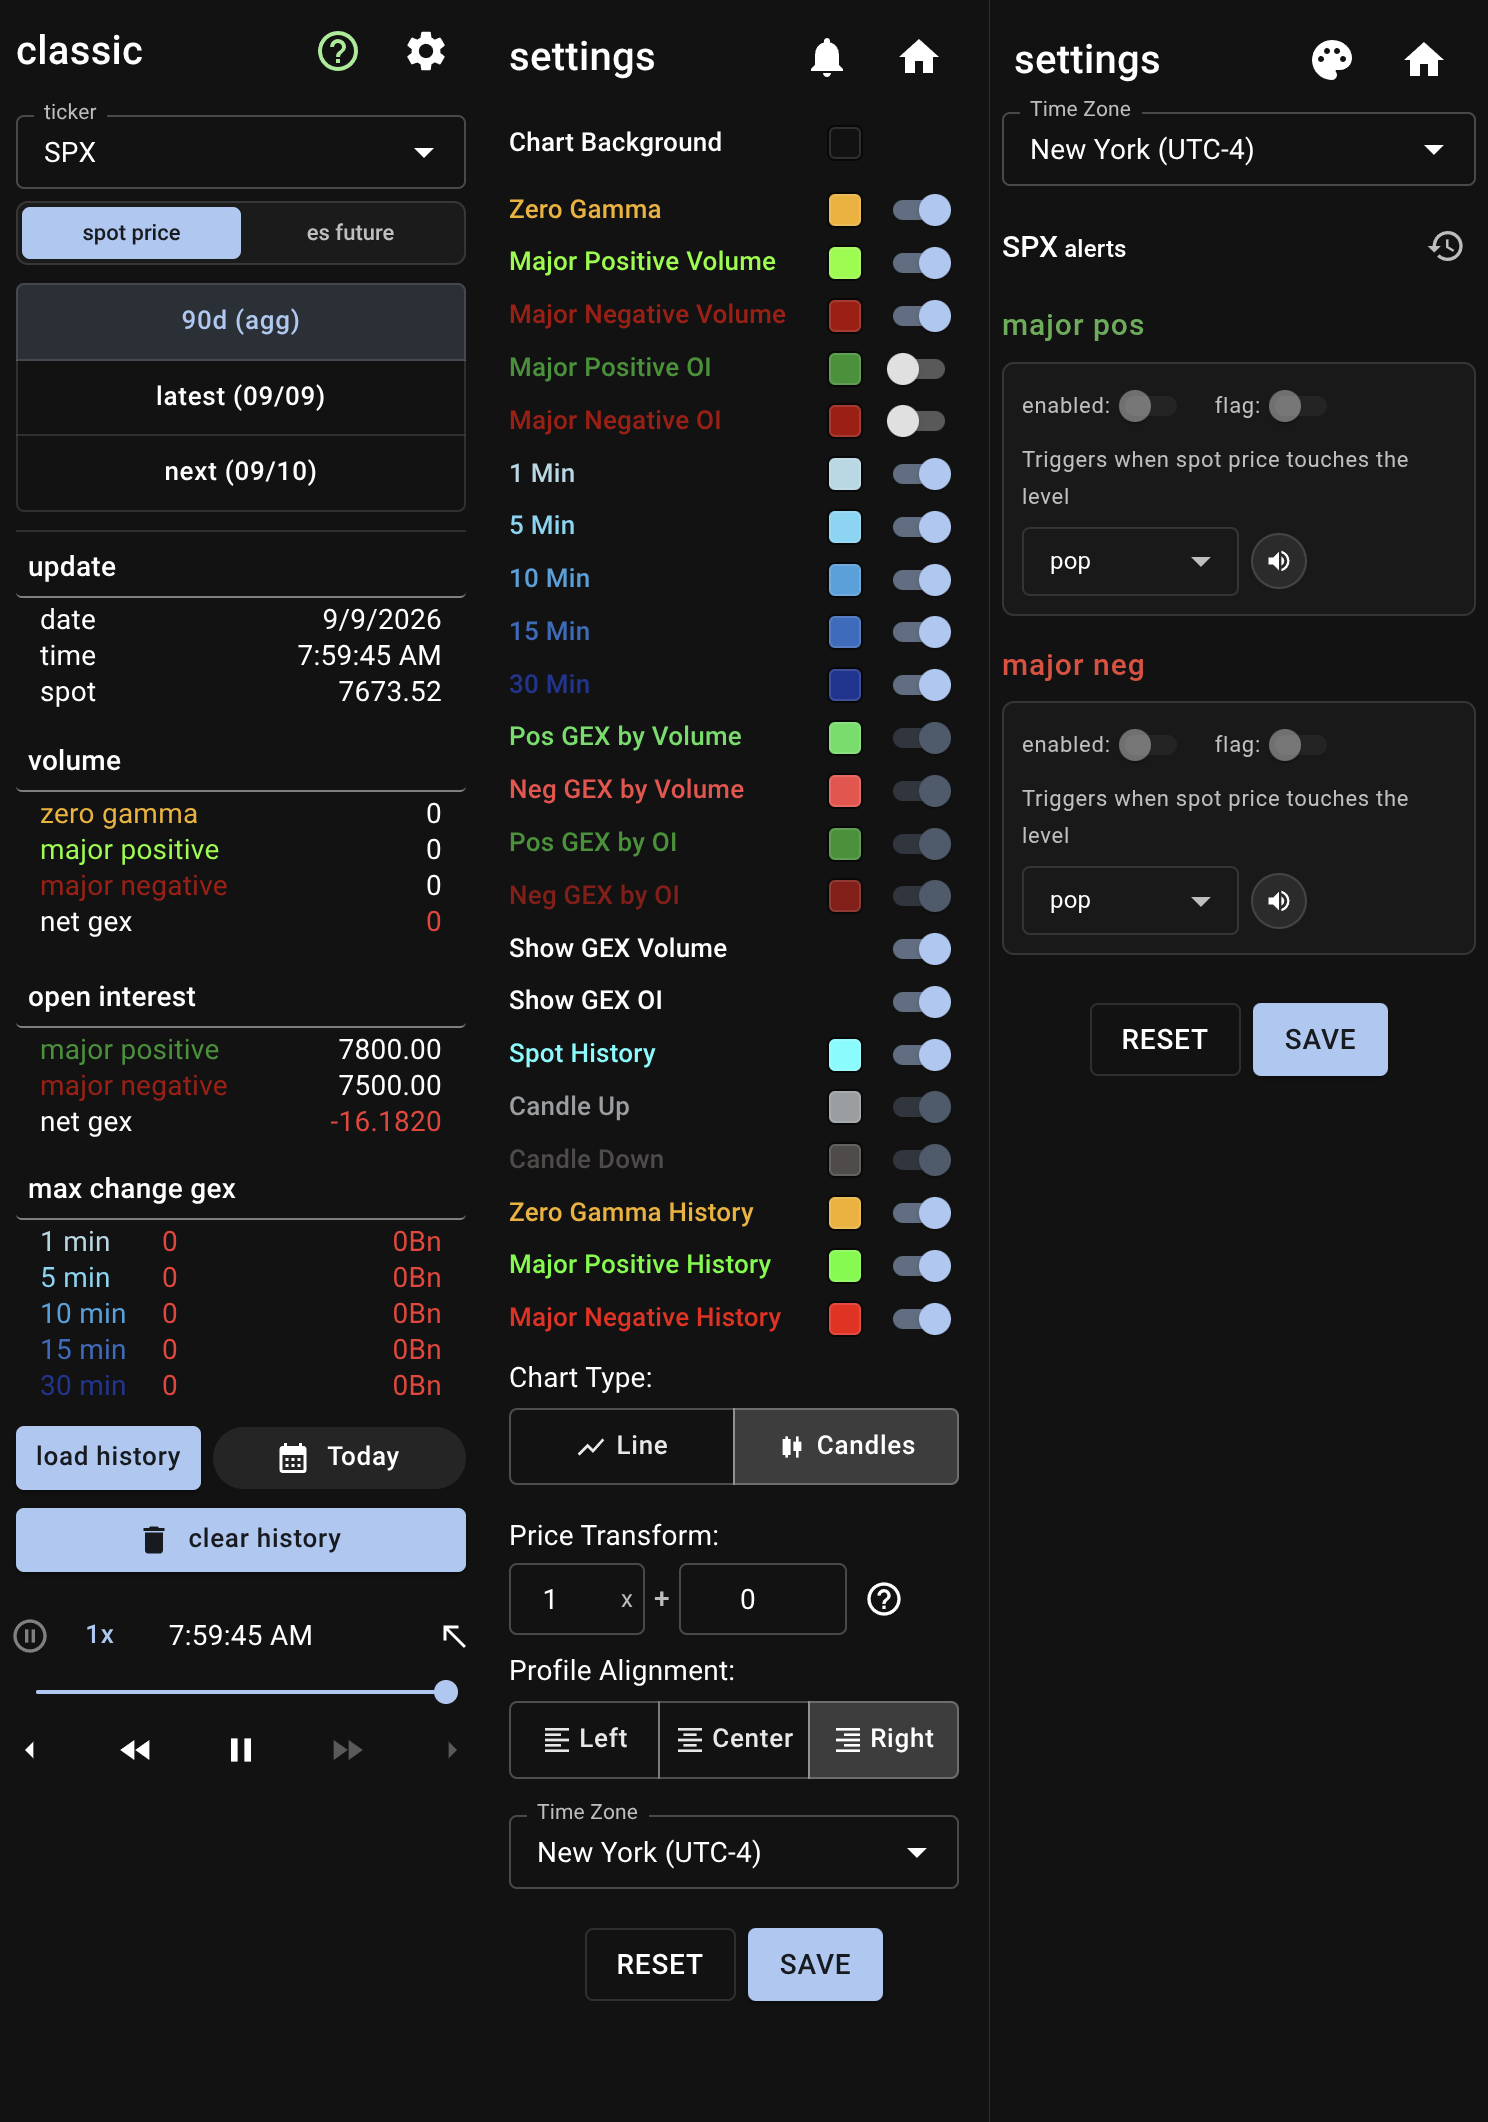
Open the Classic settings panel by clicking the Settings gear icon in the sidebar.
Chart Appearance & Spot View Mode
- Chart Background: Select a custom background color for dark mode in the color picker.
- Chart Type: Toggle between Line and Candles for spot price display.
- Profile Alignment: Align ladder profile bars to the Left, Center, or Right of the chart canvas.
GEX Display Elements
Configure colors, sizes, and visibility switches for all ladder components:
- GEX Volume & Open Interest:
- Toggle visibility for Show GEX Volume and Show GEX OI.
- Adjust the bar thickness slider for positive and negative volume or OI bars.
- Major Levels:
- Toggle display and customize colors for Zero Gamma, Major Positive Volume, and Major Negative Volume.
- Toggle display and customize colors for Major Positive OI and Major Negative OI.
- Historical Lookback Dots:
- Customize colors and adjust dot radii (1.0 to 10.0) for 1 Min, 5 Min, 10 Min, 15 Min, and 30 Min prior dots.
- Spot History:
- Customize spot line color, width, and line type (
solid,simple-dashed,dashed,dotted). - Toggle the vertical spot guide line inside the Spot History color picker popup. The chart provides no toggle for a horizontal crosshair line.
- Customize spot line color, width, and line type (
- Historical Level Lines & Draw Style Trade-Offs:
- Toggle Zero Gamma History, Major Positive History, and Major Negative History lines.
- Select the draw style between scatter and line:
- line (Recommended for web): A 300-period moving average. Renders quickly and provides smooth panning and zooming in web browsers.
- scatter: Plots raw historical major points at full tick resolution. This mode requires heavy browser rendering and can slow down panning and zooming. Desktop platform integrations (Sierra Chart, NinjaTrader, ATAS, Quantower) plot scatter majors natively without lag.
Price Transform (Multiplier)
Convert price scales between index products, futures, and ETFs:
- Formula:
(Price * Multiplier) + Additive. - Futures Offsets: Apply multiplicative and additive values to convert index strikes to futures levels (
SPXtoES,NDXtoNQ). - ETF Scaling: Convert cash index strikes to ETF share price targets (
SPXtoSPY,NDXtoQQQ).
Spot Touch Alerts
Configure automated alerts when spot price touches key gamma levels:
- Monitored Levels: Configure independent alerts for Major Positive Volume and Major Negative Volume.
- Visual Flag: Display a temporary on-chart badge showing the touched level price for 3 seconds.
- Audio Alerts: Choose from 7 alert sounds (
pop,bass,bright,phone,chime,wind-chime,bell). - Volume Control: Adjust the alert playback volume slider from 0% to 100%.
- Alert History: Click the history icon to inspect the timestamped log of triggered alerts.
Navigation & Keyboard Shortcuts
- Scale GEX Bars Only: Scroll the mouse wheel while hovering over the top value (GEX) axis to scale bar widths without altering time scaling.
- Horizontal Zoom (Bars & Time): Scroll the mouse wheel over the canvas to scale profile bar widths and time together.
- Vertical Price Zoom: Hold
Ctrlwhile scrolling the mouse wheel to zoom the strike price axis. - Pan Canvas: Click and drag anywhere on the chart canvas to pan both axes.
- Reset Scaling: Double-click the canvas or click the floating reset button (
RestartAltIcon) to restore automatic scaling. - Fullscreen: Press
Shift + Fto toggle fullscreen mode. - Snapshot Export: Press
Ctrl + Shift + Sto copy the chart image, orCtrl + Alt + Sto download a PNG image.