overview
Real-time classified options positioning, Delta exposure ladders, Convexity profiles, and Vanna/Charm Greek sensitivities.
The gexbot State Package provides classified options profile analytics. It classifies aggressive taker orderflow and maps exposure across multiple Greek dimensions.
State Chart Views
Options Profile (OP)
Live strike-by-strike classified trade volume, bid/ask fills, and implied volatility skew dots.
GEX Profile
Classified Gamma Exposure profiles separated across 90-day aggregate, 0 DTE, and 1 DTE horizons.
DEX Ladder
Delta Exposure (DEX) ladders measuring directional taker delta exposure per point move in underlying spot.
Convexity Ladder
Taker gamma exposure across strikes.
Vanna & Charm Profiles
Second-order sensitivity to implied volatility shifts (Vanna) and overnight time-decay pinning (Charm).
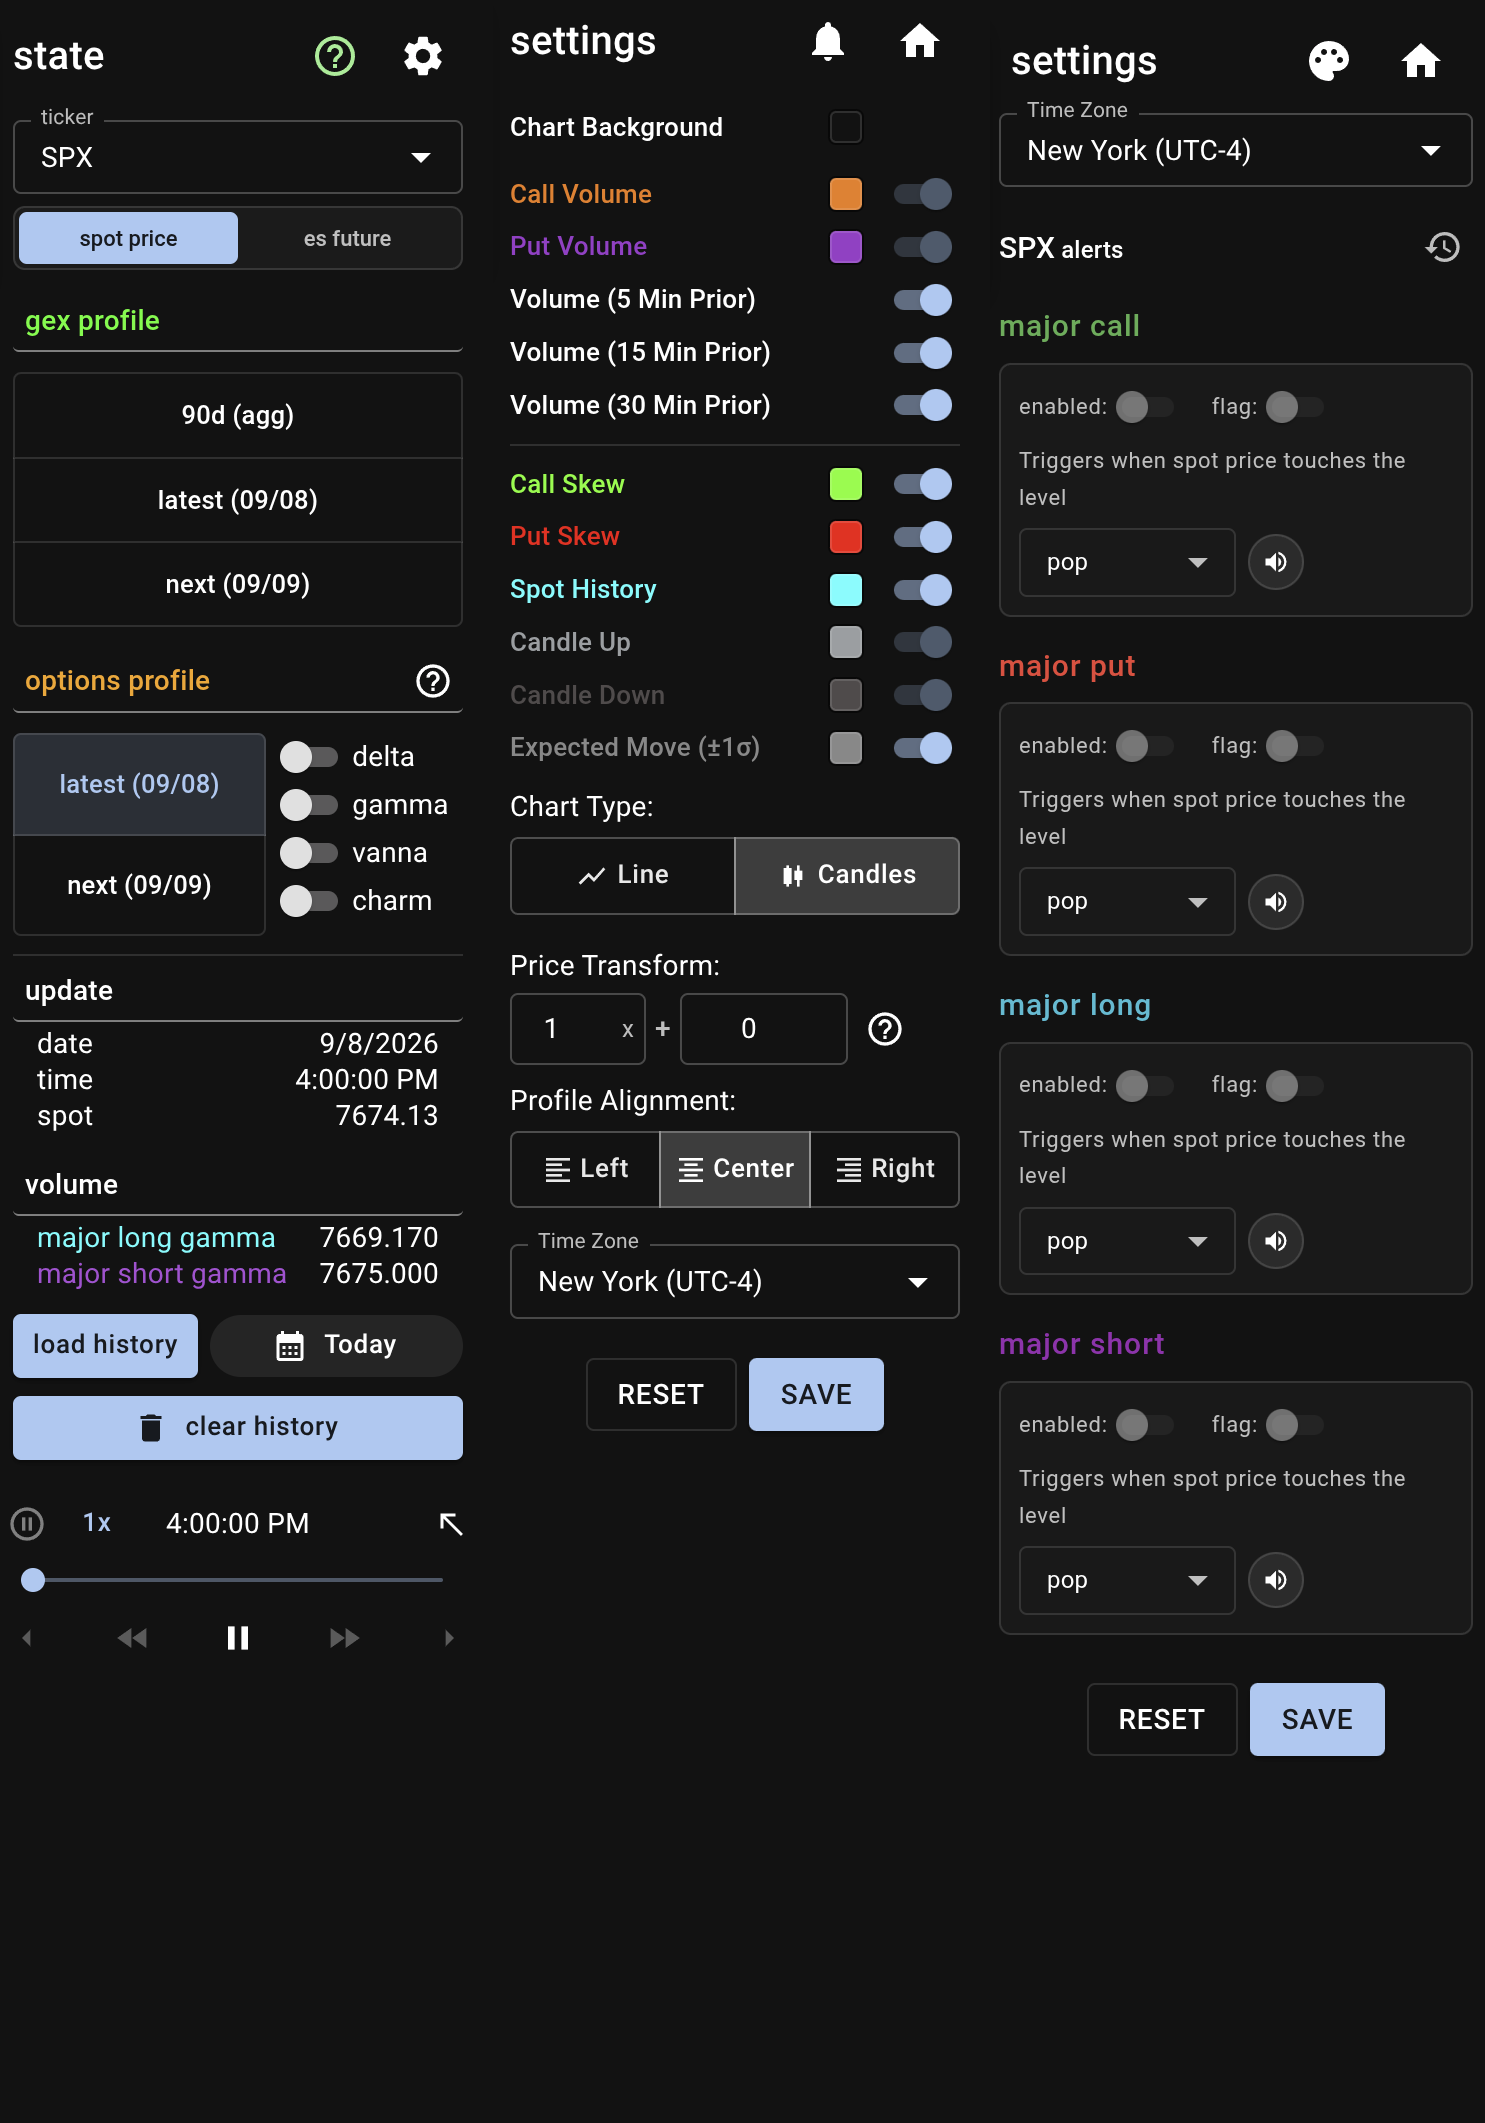
Open the State settings panel by clicking the Settings gear icon in the sidebar while viewing any State chart.
Chart Appearance & Spot View Mode
- Chart Background: Select a custom background color for dark mode in the color picker.
- Chart Type: Toggle between Line and Candles for spot price display.
- Profile Alignment: Position profile bars to the Left, Center (default), or Right of the chart canvas.
Strike & Greek Display Settings
Configure display properties for the active contract and Greek dimensions:
- Profile Bars:
- Customize colors for positive and negative contract volume or Greek exposures.
- Adjust bar thickness sliders (1.0 to 10.0) to scale horizontal bars.
- Toggle visibility for 1 Min, 5 Min, 10 Min, 15 Min, and 30 Min prior lookback dots.
- Volatility Skew Dots:
- Toggle display and customize colors for Call Skew and Put Skew dots.
- Expected Move (±1σ):
- Toggle display on or off.
- Adjust line width slider (1.0 to 10.0).
- Select line style (
solid,simple-dashed,dashed,dotted). - Select label placement (
auto,left,center,right). - Select label text color and font size (8px to 24px).
- Spot History:
- Toggle display of spot history line, vertical crosshair, and horizontal crosshair lines.
Price Transform (Multiplier)
Convert price scales between index products, futures, and ETFs:
- Formula:
(Price * Multiplier) + Additive. - Futures Offsets: Apply custom multiplier factors to align index levels with futures contracts (
ES_SPXorNQ_NDX). - ETF Offsets: Scale strike prices to match corresponding ETF price ranges (
SPYorQQQ).
Spot Touch Alerts
Configure automated notifications for key structural levels:
- Monitored Levels: Configure independent alerts for Major Call, Major Put, Major Long Gamma, and Major Short Gamma.
- Visual Flag: Display a temporary on-chart badge showing the touched level value for 3 seconds.
- Audio Alerts: Choose from 7 alert sounds (
pop,bass,bright,phone,chime,wind-chime,bell). - Volume Control: Adjust playback volume from 0% to 100%.
- Alert History: Inspect the timestamped log of all triggered alerts in the session log.
Navigation & Keyboard Shortcuts
- Horizontal Profile Zoom: Scroll the mouse wheel over the canvas to adjust horizontal bar scale.
- Vertical Price Zoom: Hold
Ctrlwhile scrolling the mouse wheel to zoom the strike price axis. - Pan Canvas: Click and drag anywhere on the chart canvas to pan both axes.
- Reset Scaling: Double-click the canvas or click the floating reset button (
RestartAltIcon) to restore automatic scaling. - Fullscreen: Press
Shift + Fto toggle fullscreen mode. - Snapshot Export: Press
Ctrl + Shift + Sto copy the chart image, orCtrl + Alt + Sto download a PNG image.