overview
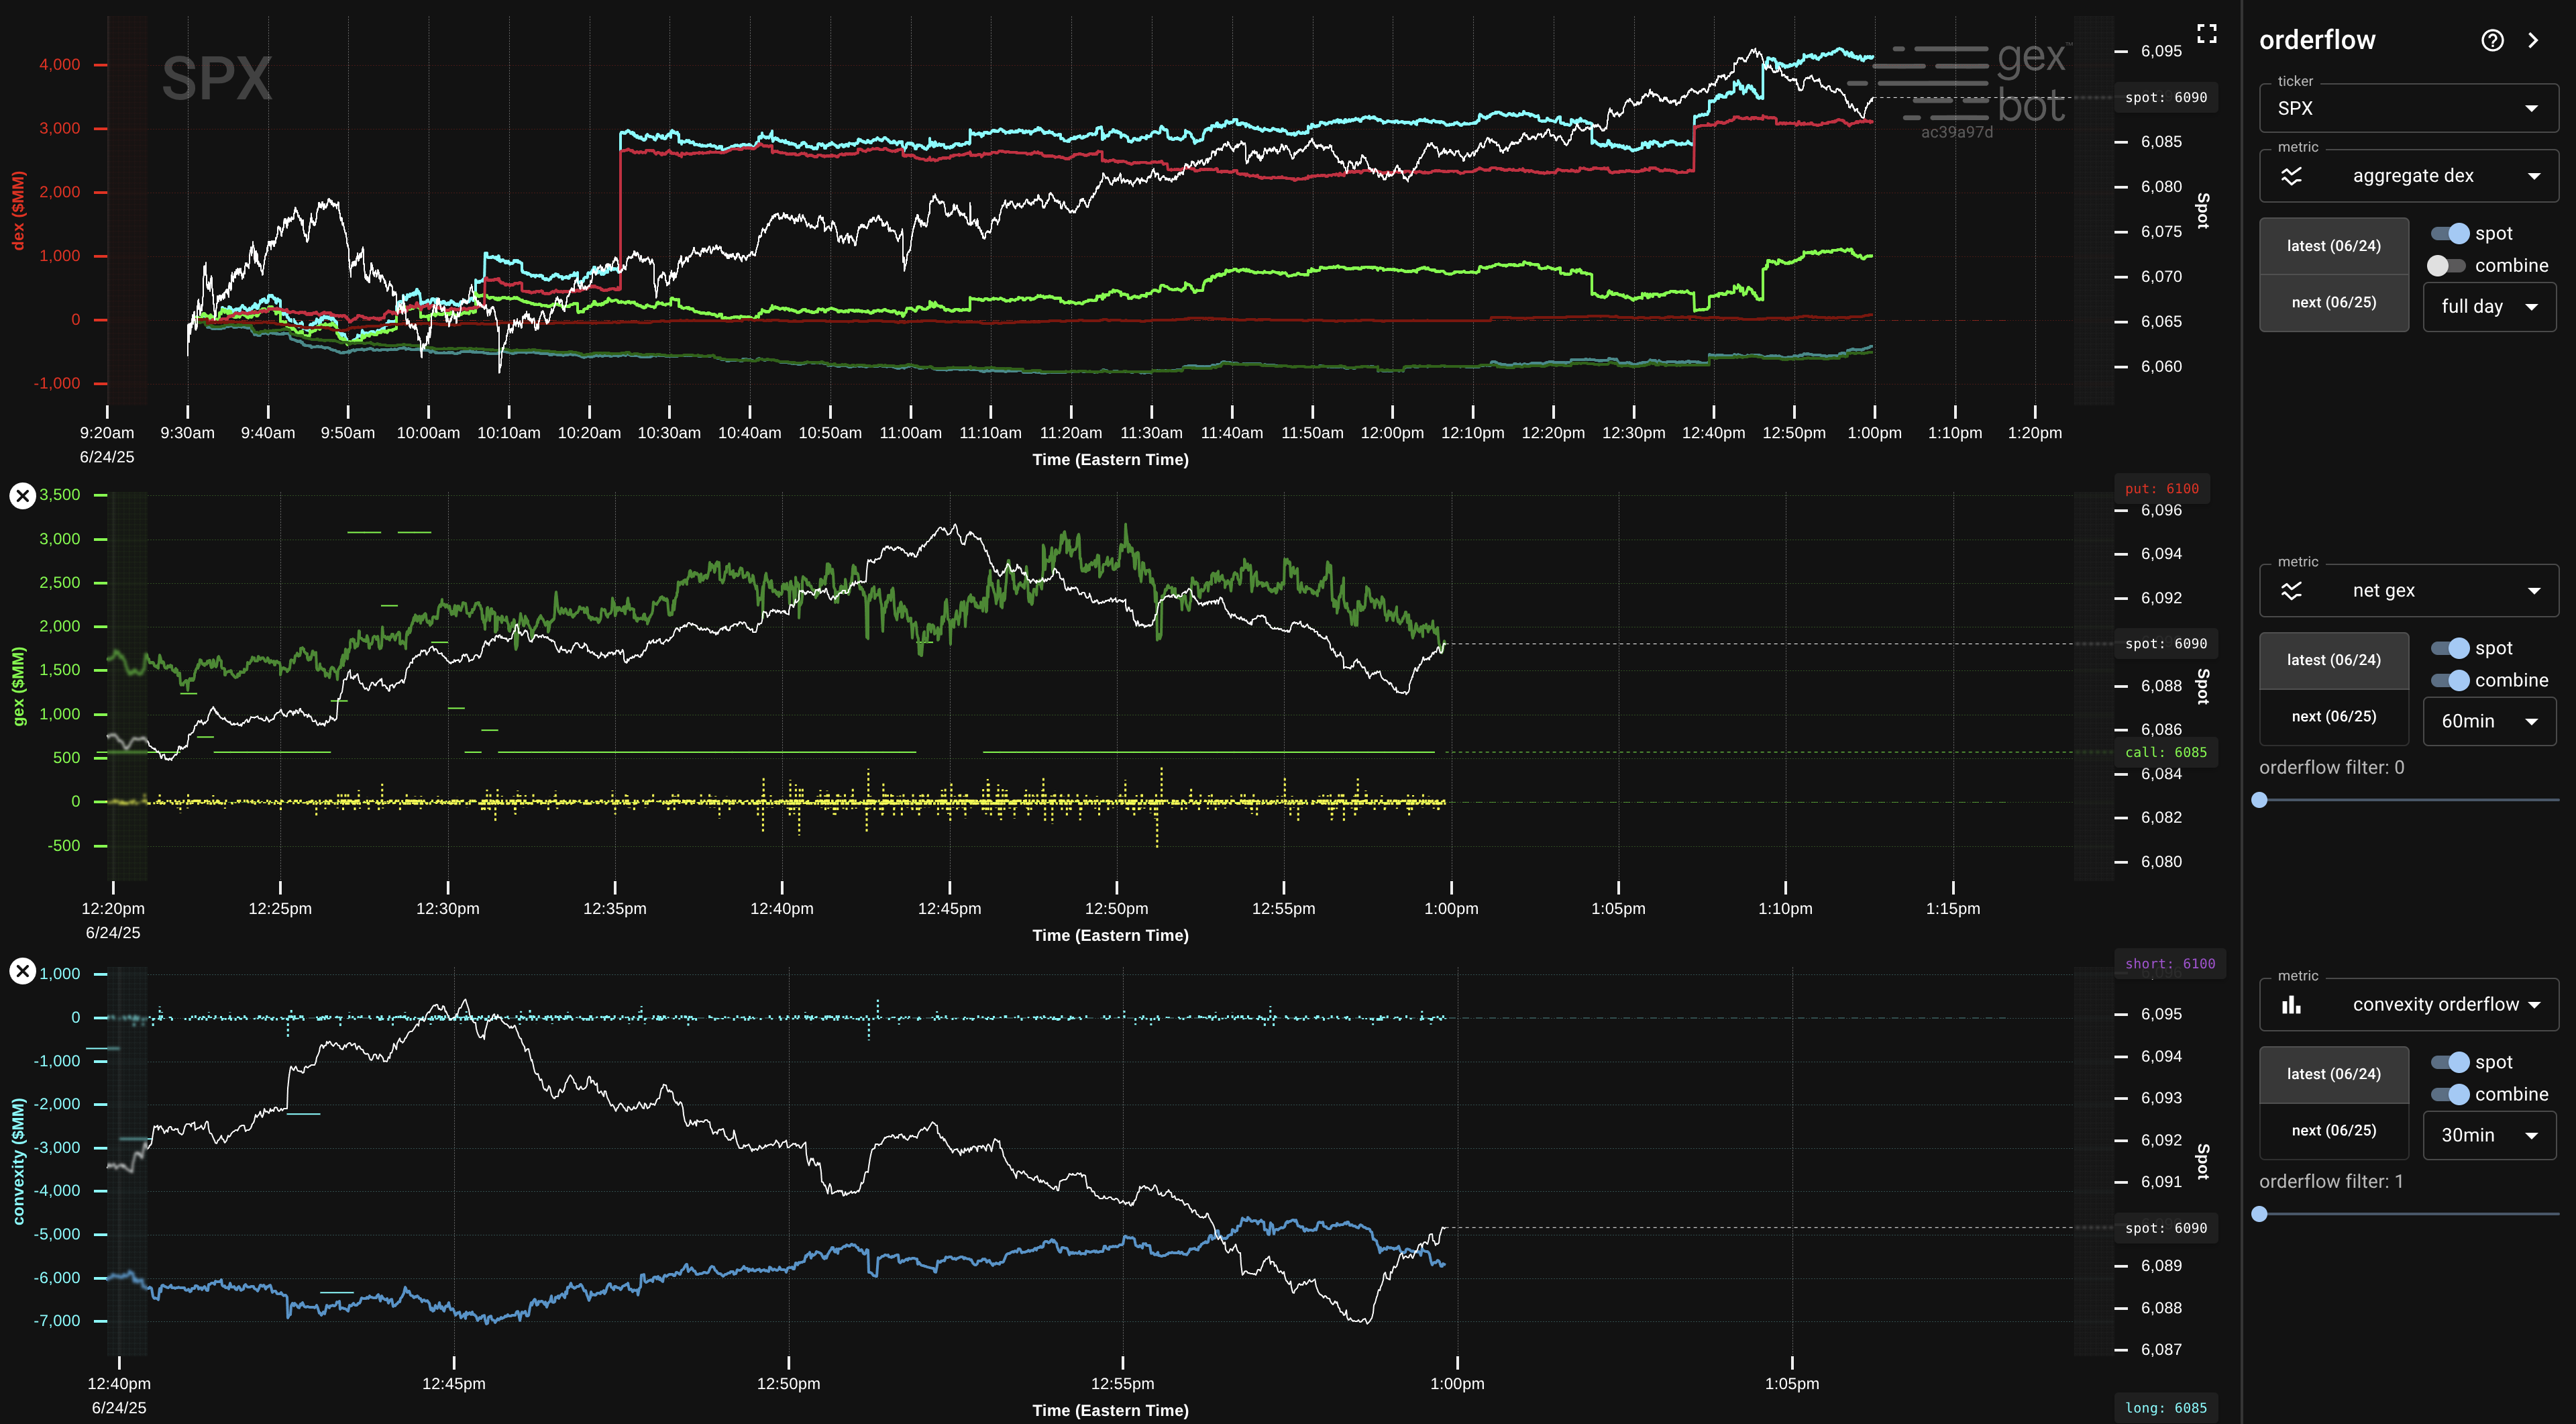
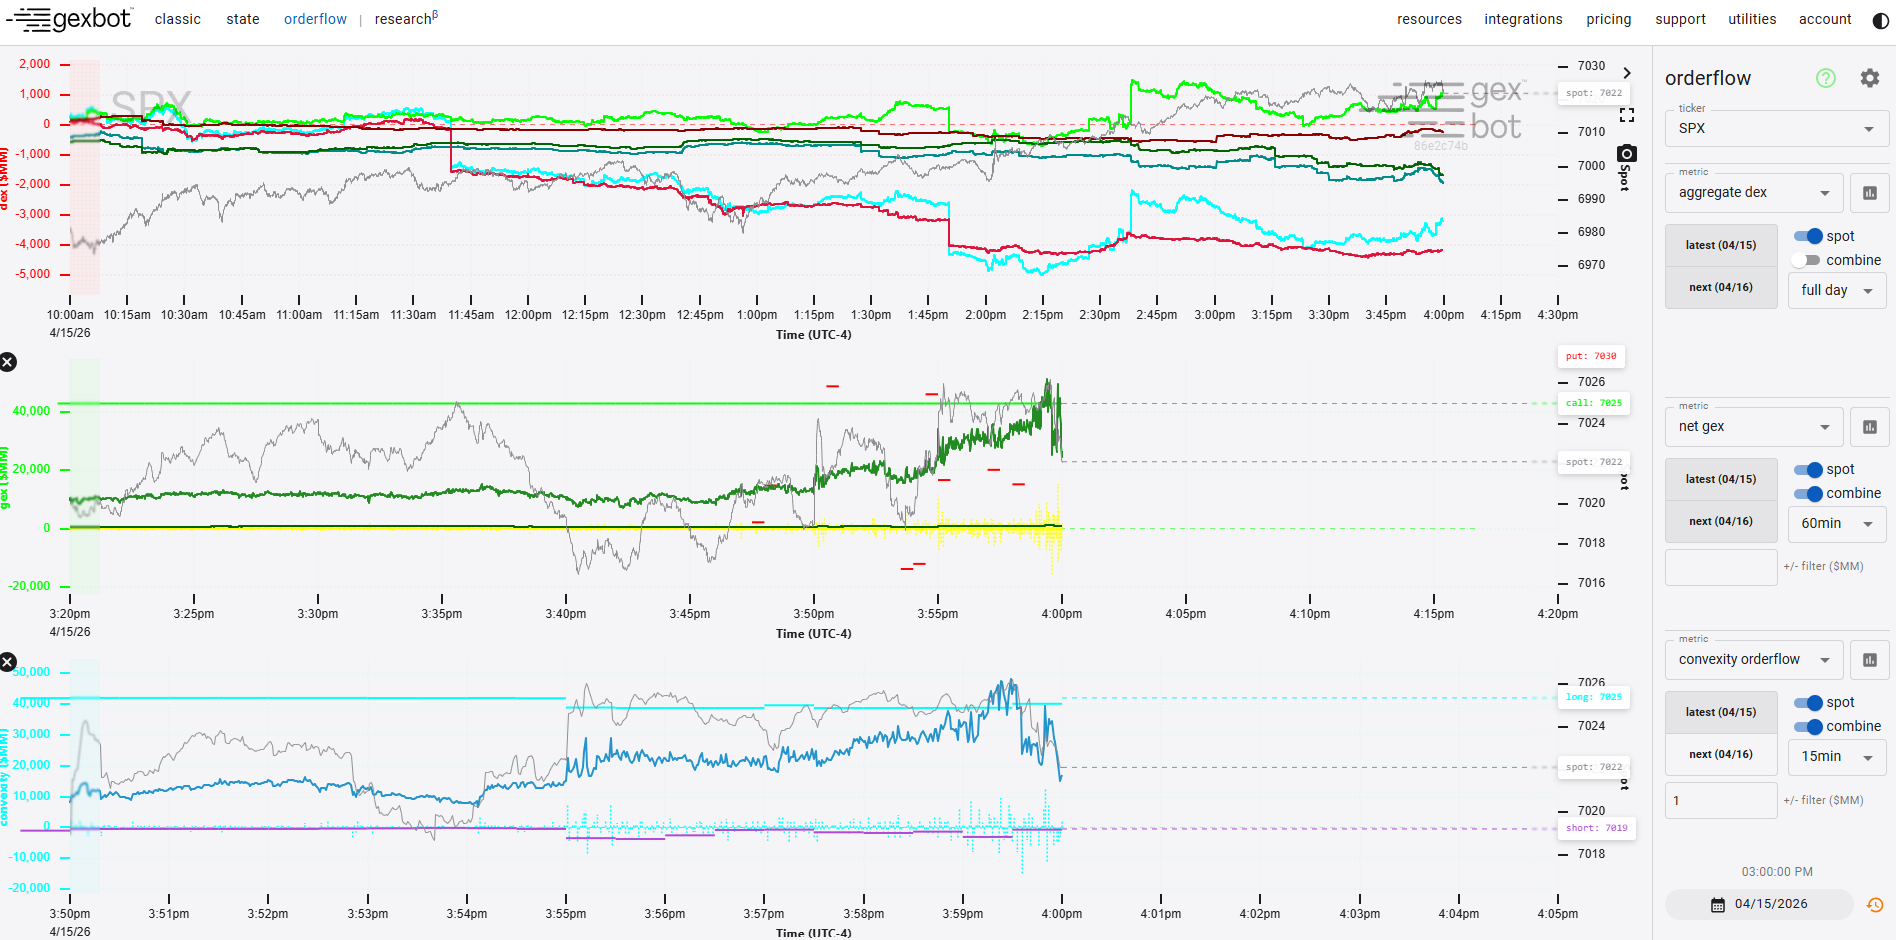
Time-based streaming charts providing real-time insight into the nearest and following expiries.
API Endpoints
Access programmatic orderflow series via the Orderflow API endpoint.
Time-based charts leverage the results of our orderflow-classification engine to give real-time insight into the nearest and following expiries (0DTE and 1DTE).
Orderflow subplots detect changes in overall positioning: Any time an order comes through, we measure and report the delta and gamma of that order, and whether it is long or short. Orderflow helps to highlight transition points, both in terms of market direction and volatility.
"Net" subplots sum across all strikes to measure net taker exposure across the current state of the chain. They help us get a sense for whether the options complex is in line with price action.
In following our options profile, all plots and equations are in terms of paper (taker) positioning.
Available Subplot Metrics (13 Dimensions)
Each orderflow chart block can render any of the following 13 metrics:
- GEX Suite:
GEX Orderflow: The change in taker GEX over the last second.Net GEX: Net taker gamma exposure across the current state of the chain.
- DEX Suite (Directional Pressure):
DEX Orderflow: The change in taker DEX over the last second.Net DEX: Net taker delta exposure across the current state of the chain.Net Call DEX/Net Put DEX: Segmented call and put net taker delta across the current chain.Aggregate DEX(Agg DEX): Cumulative taker delta transacted over the course of the session (since 09:30 ET).Agg Call DEX/Agg Put DEX: Segmented cumulative call and put delta transacted during the session.
- Convexity Suite:
Convexity Orderflow: The change in taker convexity over the last second.Net Convexity: Net taker gamma exposure across the current state of the chain.
- Second-Order Sensitivity:
Net Vanna: Implied volatility delta sensitivity across active expiries.Net Charm: Rate of time-decay delta bleed across active expiries.
Metric Calculation Types
To properly interpret the metrics and avoid backtest errors:
- Session Cumulative Flow (
Agg DEX,Agg Call DEX,Agg Put DEX): Tracks running transacted volume delta accumulated since 09:30 ET market open. - Current Chain Net Exposure (
Net DEX,Net GEX,Net Convexity,Net Vanna,Net Charm): Measures instantaneous net taker exposure across the current state of the chain. - Velocity Indicators (
DEX Orderflow,GEX Orderflow,Convexity Orderflow): Measures the change in taker exposure over the last second.
Threshold Filtering Mechanics
Orderflow threshold filters remove small prints to display transactions above a specified absolute size.
- DEX Orderflow (Delta Threshold in Shares): Filters out orders below a specified share-equivalent delta magnitude.
- GEX Orderflow (Gamma Threshold in $MM): Filters out orders below a specified gamma dollar value.
- Convexity Orderflow (Convexity Threshold in $MM): Filters out orders below a specified convexity dollar value.
The filter applies an absolute magnitude cutoff:
- Transactions below the threshold evaluate to zero and do not render.
- Transactions at or above the threshold render normally.
- Setting the threshold to
0disables filtering.
Synchronized Navigation Controls
- Time Zoom: Scroll mouse wheel over the canvas to zoom time horizontally.
- Metric Scale Zoom: Scroll mouse wheel over the left axis to scale the metric Y-axis.
- Spot Price Zoom: Scroll mouse wheel over the right axis to scale the spot price Y-axis.
- Synchronized Zoom: Hold
Ctrl(orCmd) while scrolling to zoom that scale across all subplots simultaneously. - Synchronized Pan: Hold
Ctrl(orCmd) while dragging to pan across all subplots simultaneously. - Direct Vertical Zoom: Hold
Shiftwhile scrolling on canvas to scale the metric axis (left half) or spot axis (right half). - Reset Zoom: Double-click the canvas or click the floating reset button (
RestartAltIcon) to restore automatic scaling.
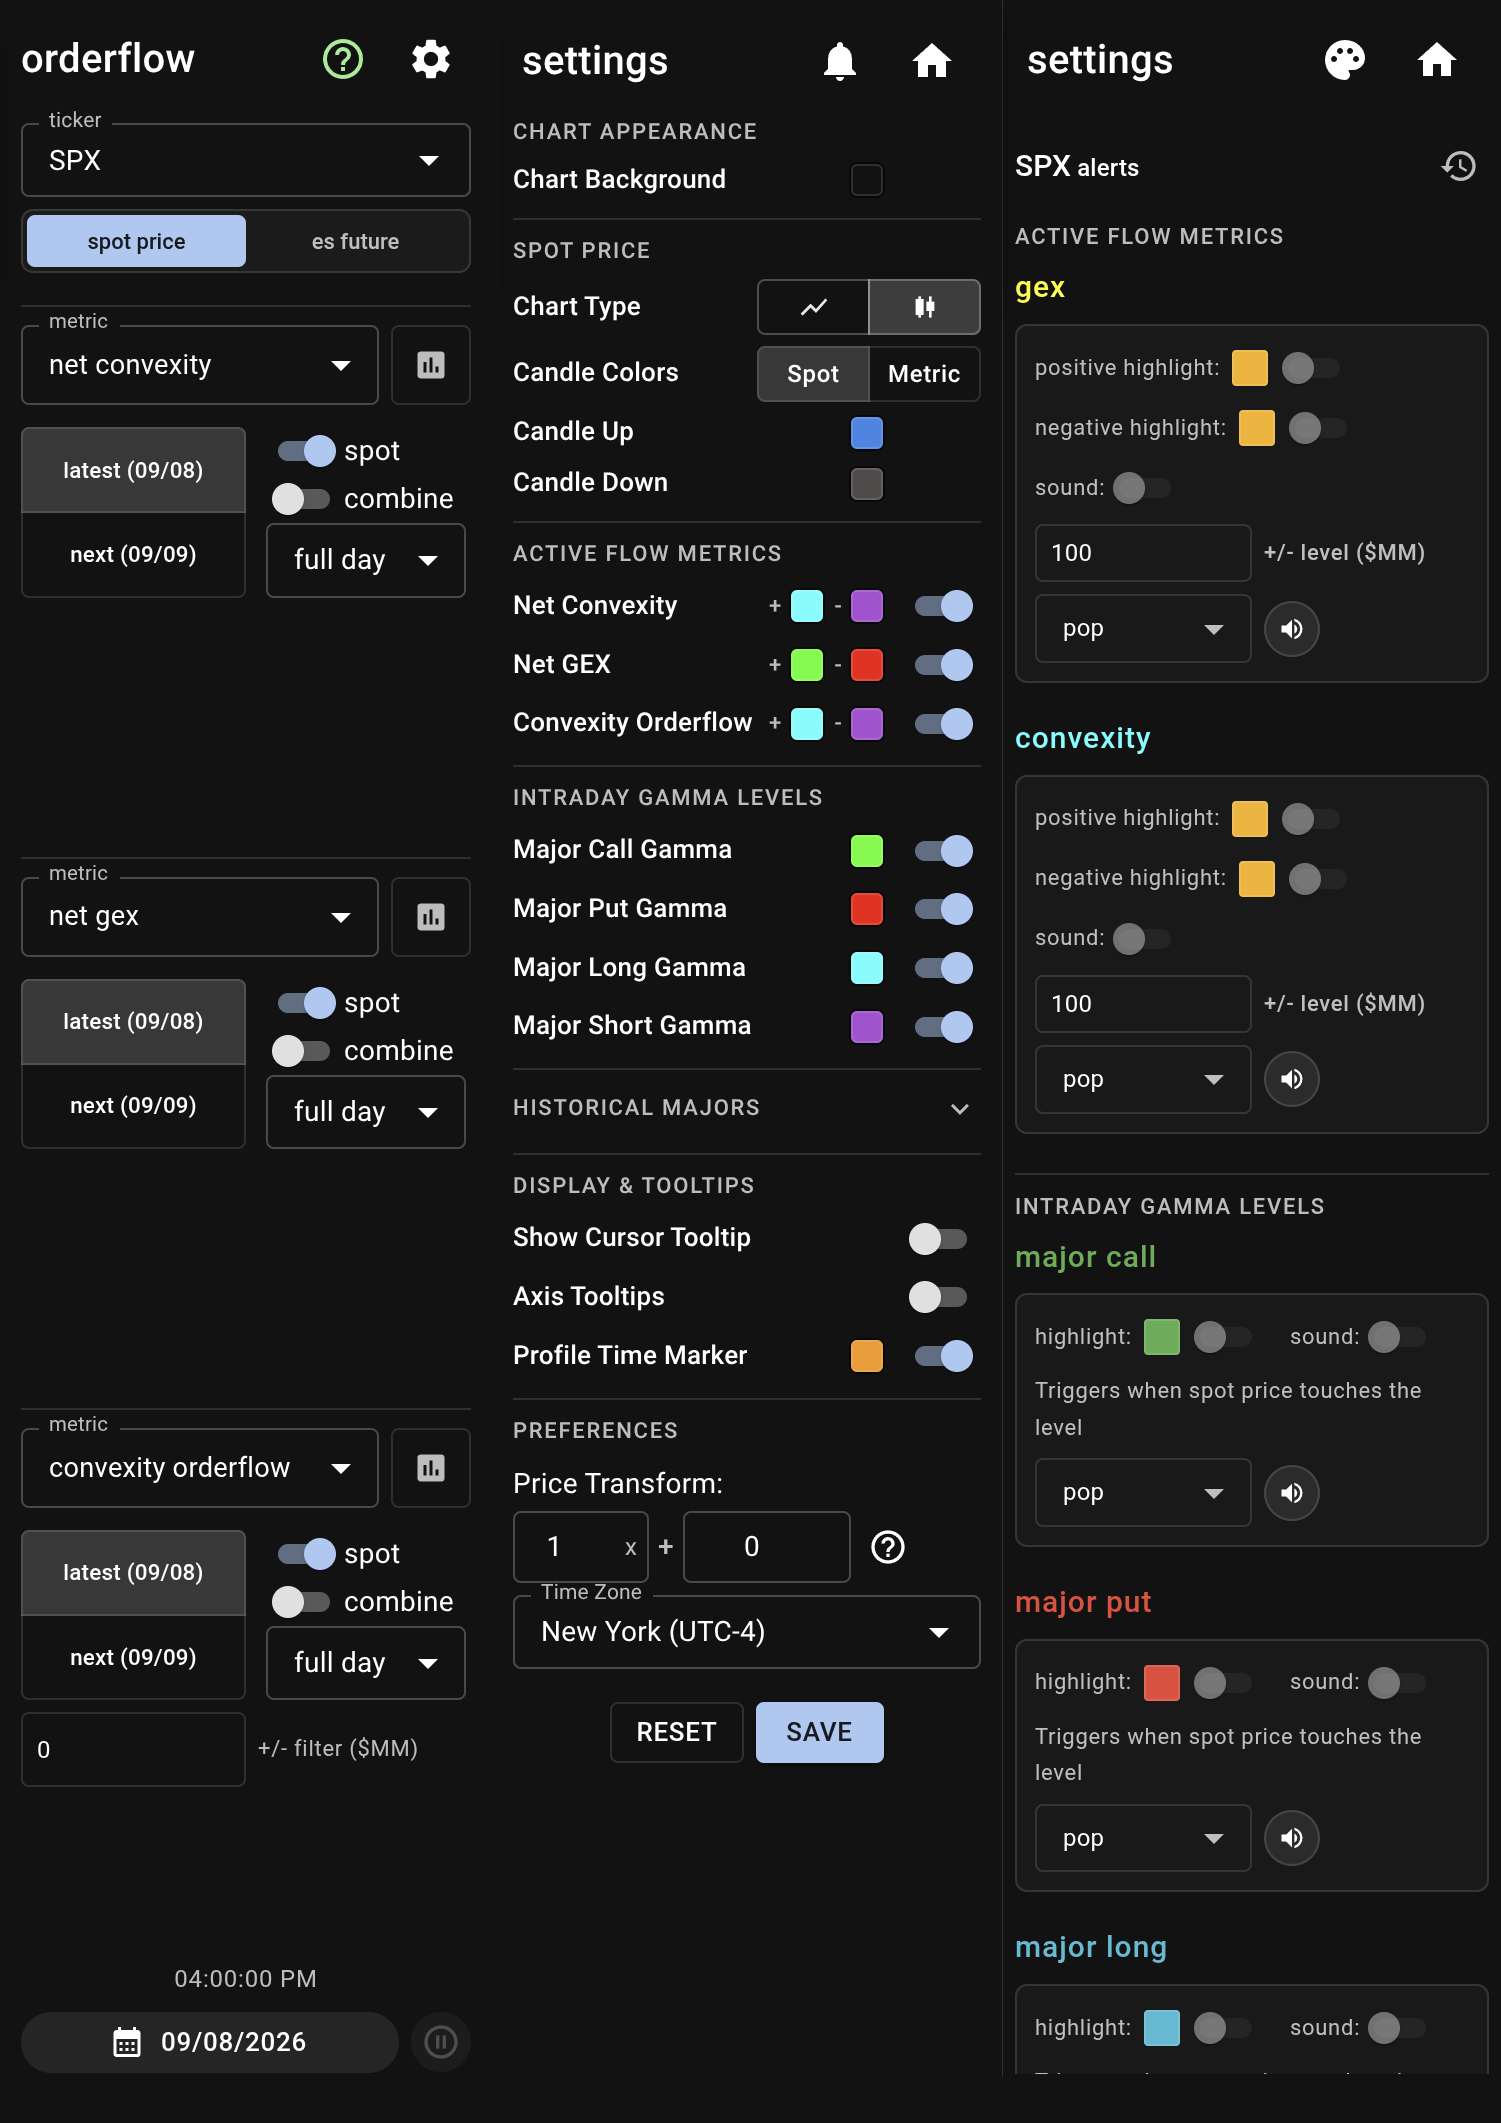
Open the Orderflow settings panel by clicking the Settings gear icon in the sidebar.
Subplot Control Blocks
Each active subplot on the chart canvas features localized controls in its header:
- Metric Selector: Choose which of the 13 orderflow dimensions to display in that subplot.
- Expiry Toggles (
latest/next): Toggle 0DTE and 1DTE streams independently. - Combine Switch: Combine 0DTE and 1DTE into a single net stream.
- Spot Price Toggle: Overlay underlying spot candles or price line onto the subplot.
- Lookback Duration: Select duration window (
15m,30m,60m,90m,2h,3.5h,full day). - Subplot Threshold Filter: Enter a minimum magnitude in
$MM(or shares) to filter prints.
Chart Appearance & Spot Price
- Chart Background: Select a custom canvas background color for dark mode in the color picker.
- Chart Type: Toggle between Line and Candles for spot price display.
- Candle Colors Mode: Choose Spot to color candles by price direction, or Metric to color candles by net flow sign.
- Candle Colors: Customize colors for upward and downward candle bodies.
Active Flow Metrics (Signed Colors)
Subplots with signed metrics display positive and negative color pickers with a shared visibility toggle:
- Net Convexity (
zcvr/ocvr): Configure colors for positive and negative convexity. - Net Vanna (
zvanna/ovanna): Configure colors for positive and negative Vanna. - Net Charm (
zcharm/ocharm): Configure colors for positive and negative Charm. - Aggregate DEX (
agg_dex/one_agg_dex): Configure colors for positive and negative cumulative delta. - Net DEX (
net_dex): Configure colors for positive and negative net taker delta. - Net GEX (
zgr/ogr): Configure colors for positive and negative net gamma. - Orderflow Velocity (
dexoflow,gexoflow,cvroflow): Configure velocity bar colors for 0DTE and 1DTE streams.
Intraday Gamma Levels & Historical Majors
- Intraday Levels: Toggle visibility and select colors for Major Call Gamma, Major Put Gamma, Major Long Gamma, and Major Short Gamma.
- Historical Majors: Expand the collapsible header to toggle Zero Gamma History, Major Positive History, and Major Negative History lines.
Display & Tooltips
- Show Cursor Tooltip: Toggle display of cursor value box on hover.
- Axis Tooltips: Toggle display of value boxes on X and Y axes.
- Profile Time Marker:
- Customize color and toggle visibility.
- Adjust line width slider (1 to 10) and opacity slider (0% to 100%).
- Select line style (
none,solid,dashed,dotted).
Threshold Filters
Filter baseline market noise directly within subplot control headers:
- Filter Input: Enter a minimum threshold in
$MM(or shares for DEX) in the+/- filterinput box. - Reset Threshold: Double-click the input field to reset the threshold to 0.
- Supported Subplots: DEX Orderflow, GEX Orderflow, Convexity Orderflow, and combined metric subplots.
Profile Overlay Settings
Click the floating GEXbot logo button in any subplot to open the profile overlay settings:
- Profile Slots: Configure up to 3 independent overlay profiles per subplot.
- Category & DTE: Select between GEX (Volume or OI) and Greek dimensions (Delta, Gamma, Vanna, Charm) across 0DTE and 1DTE horizons.
- Alignment: Align profile bars to the Left, Center, or Right of the chart canvas.
- Geometry & Opacity: Adjust profile width (0% to 100%), bar width, and opacity sliders.
- Vertical Pixel Offset: Nudge profile alignment vertically from -100px to +100px.
- Time Scrubbing: Drag the time marker or use the timeline slider to scrub through intraday profile snapshots.
Preferences & Alerts
- Price Multiplier: Apply affine conversion
(Price * Multiplier) + Additivefor futures and ETFs. - Timezone: Select your preferred timezone for chart timestamps.
- Flow Spike Alerts: Set alert thresholds in
$MMfor DEX, GEX, and Convexity spikes with custom positive/negative highlights. - Major Level Touch Alerts: Configure notifications when spot price touches Major Call, Major Put, Major Long, or Major Short levels.
- Alert Audio & History: Select from 7 audio tones, adjust playback volume, and inspect the alert history log.