orderflow
net gex
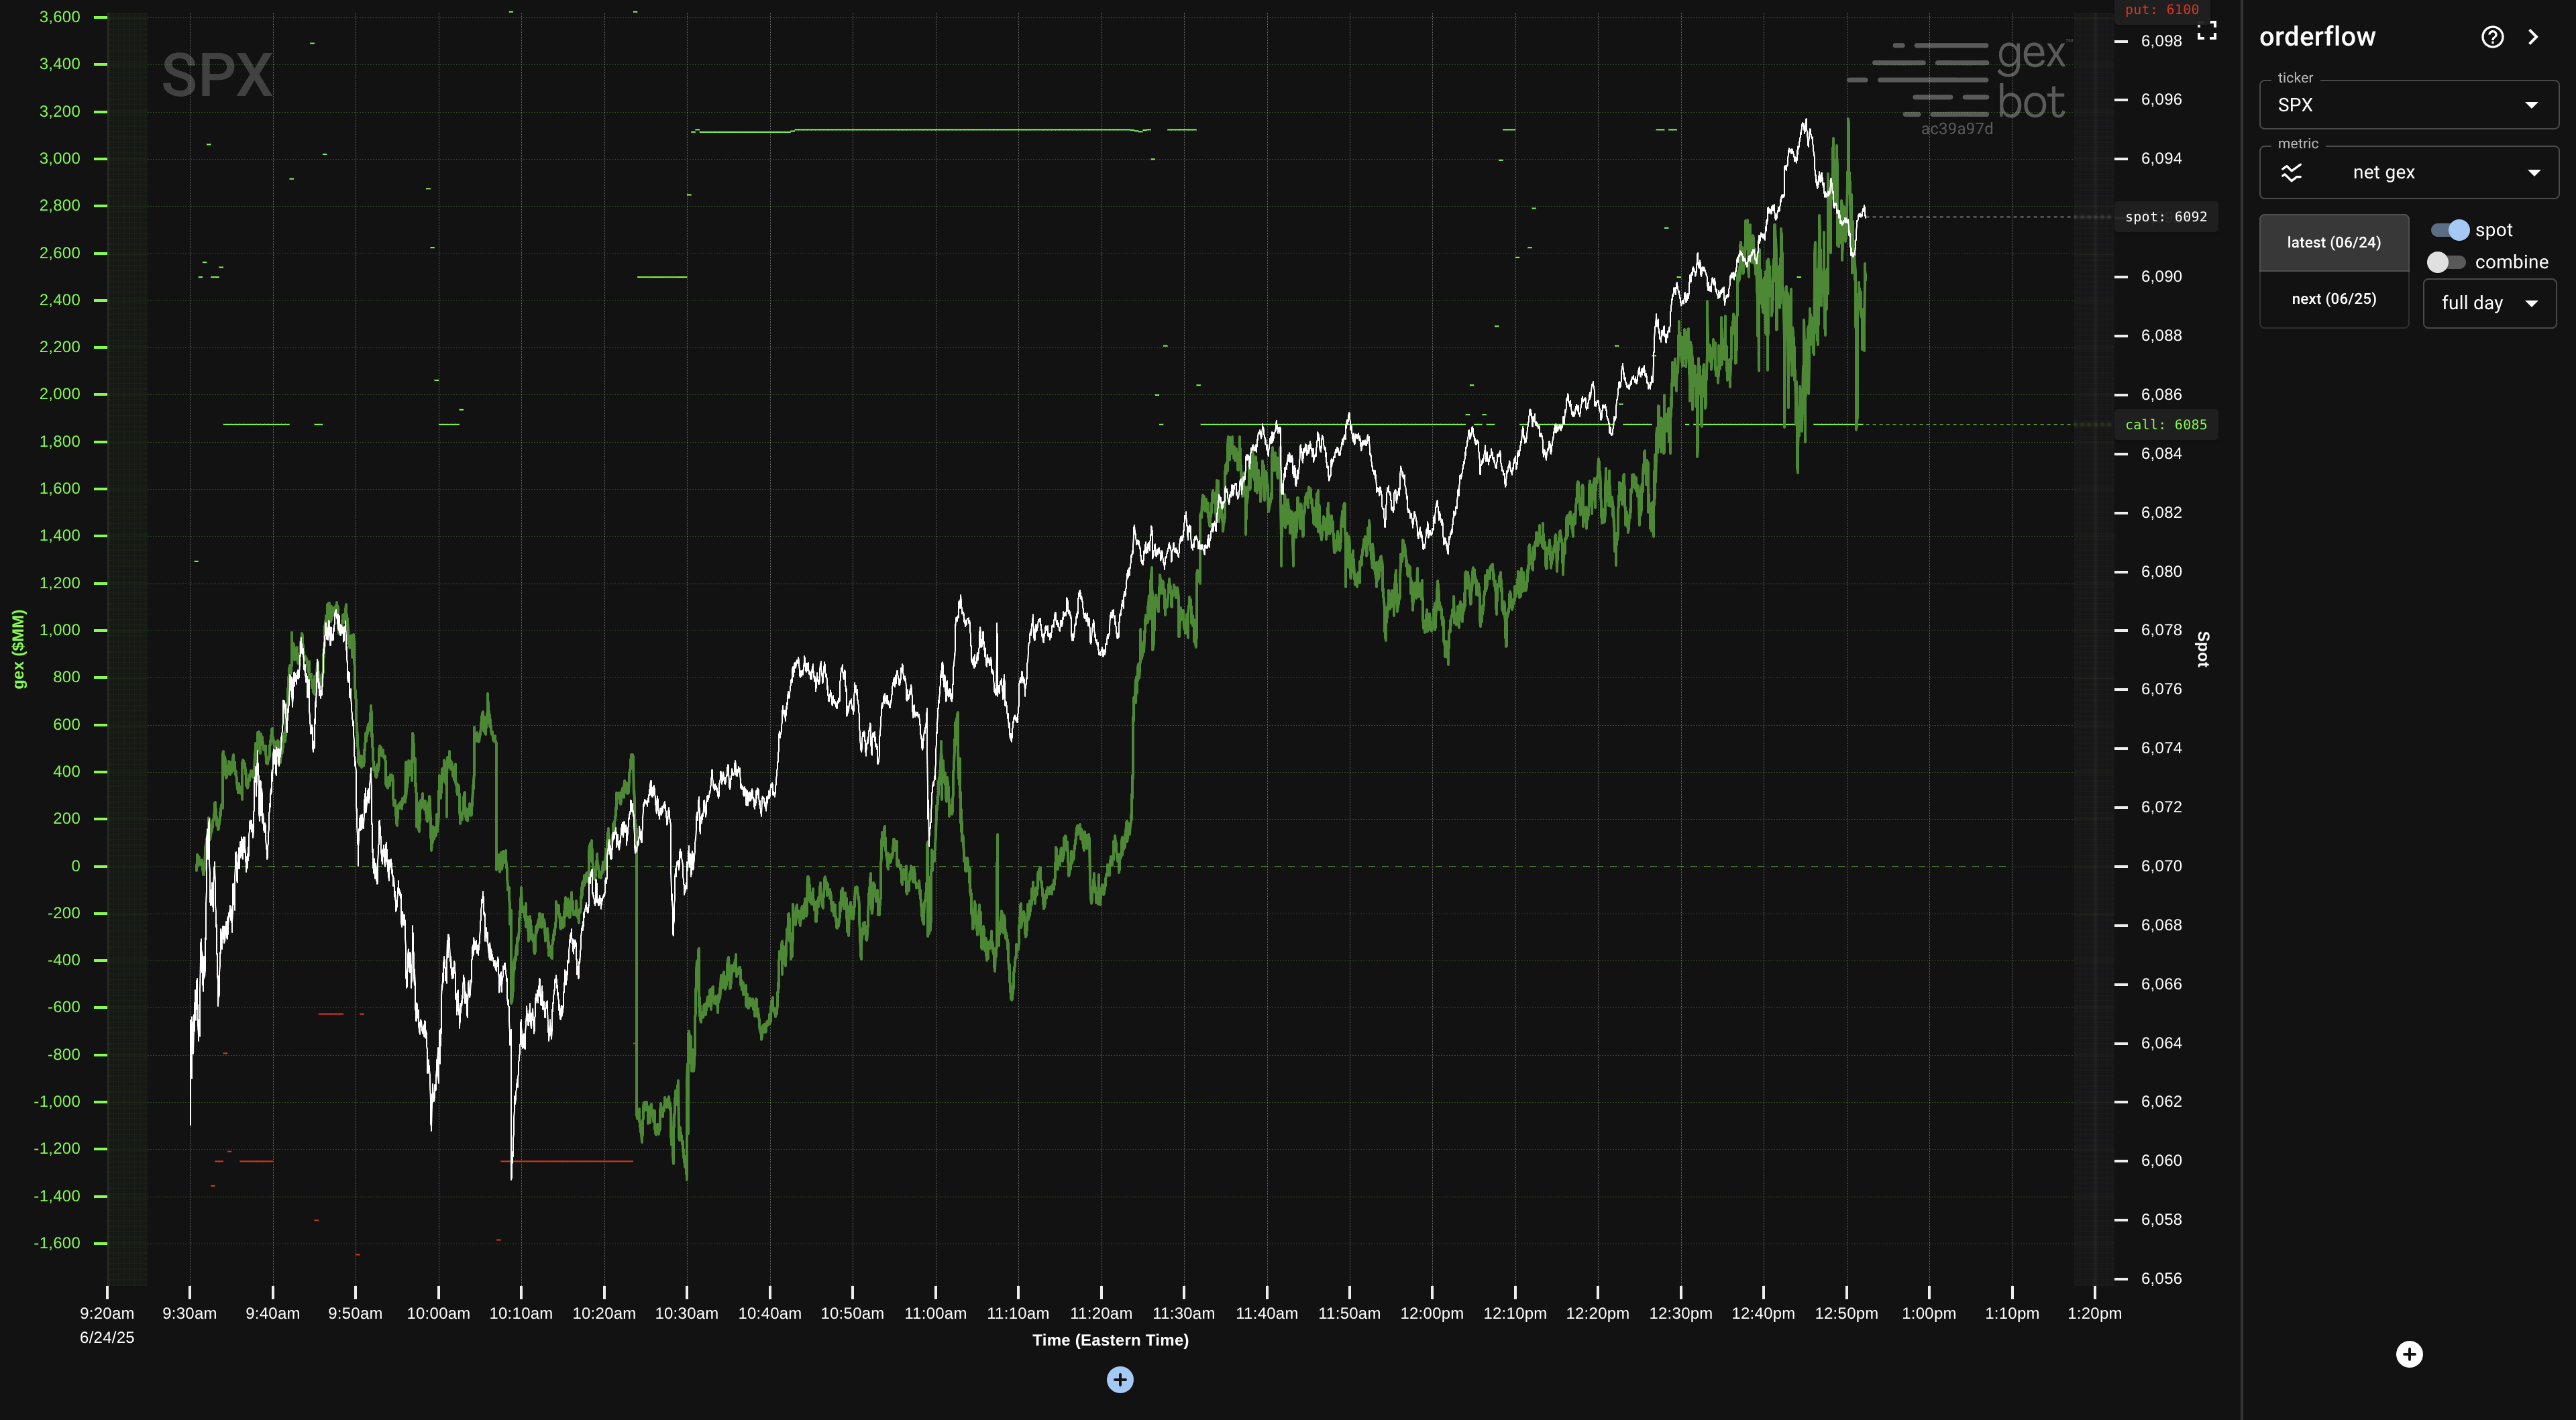
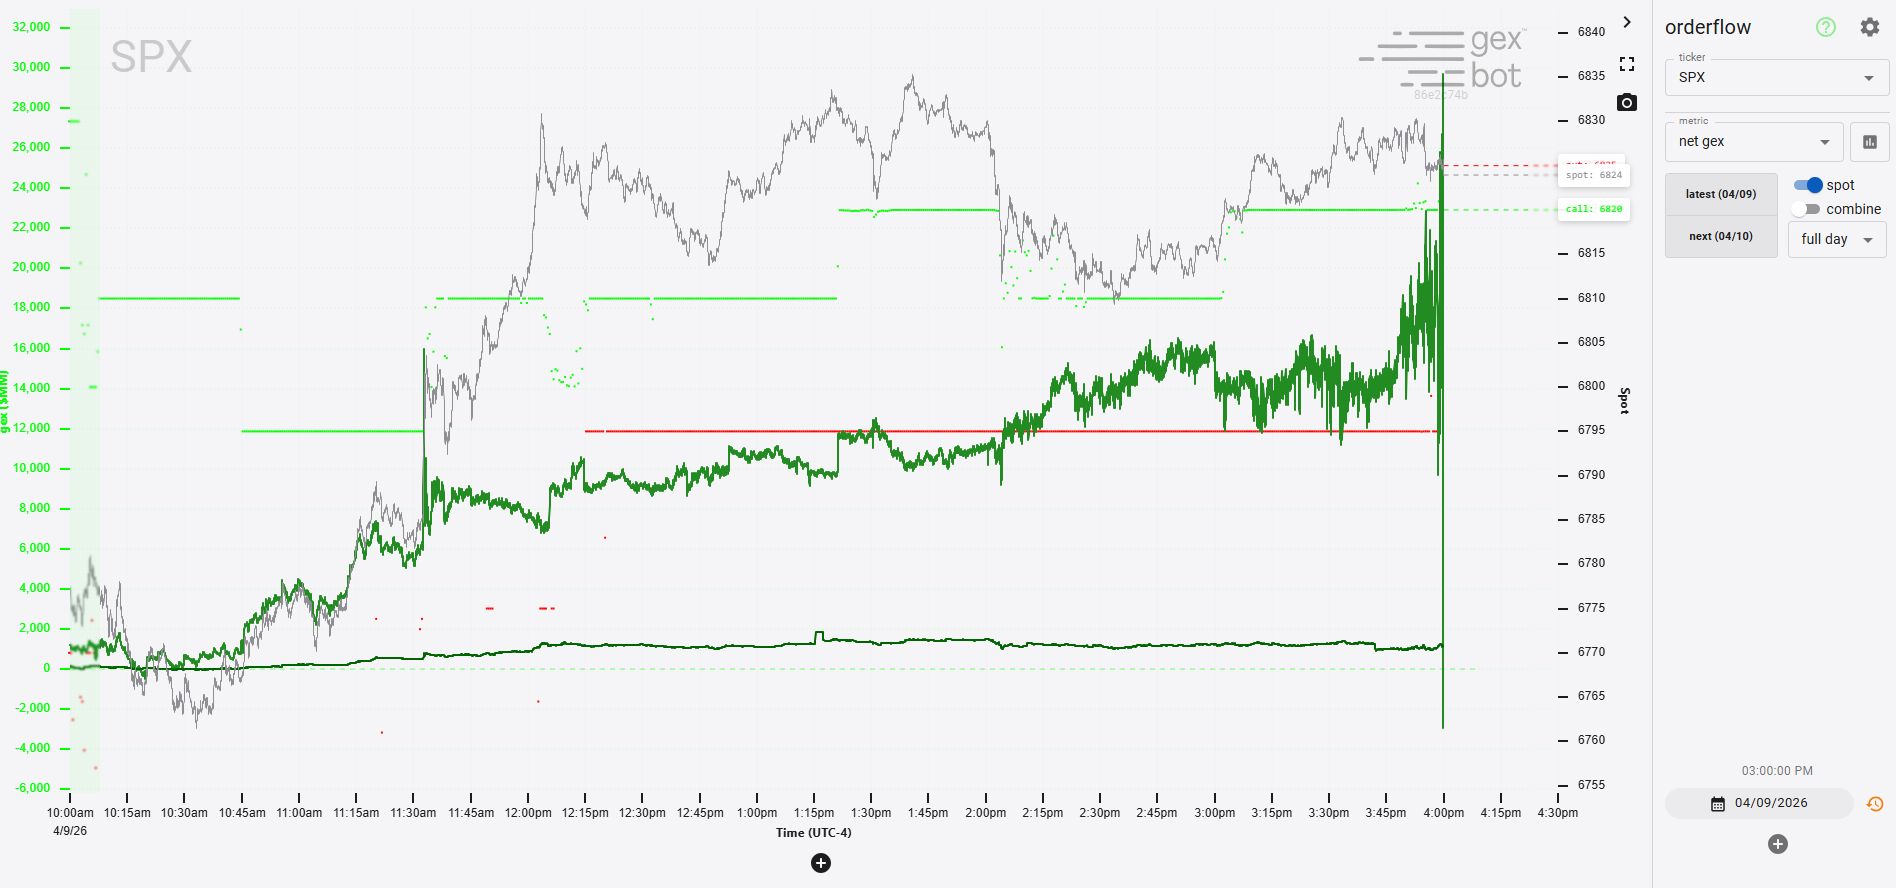
Net gamma exposure across strikes condensed into a single continuous balance metric.
API Endpoints
Access this data from the Orderflow Latest API endpoint.
Net GEX = Total Call GEX Imbalance - Total Put GEX ImbalanceUnderstanding Net GEX
- Net GEX condenses the GEX Profile into a single measure.
- When Net GEX is high and above 0, there are more holders of call $\gamma$ than put $\gamma$.
- When Net GEX is low and below 0, there are more holders of put $\gamma$ than call $\gamma$.
- $\gamma$ is a measure of convexity. If it is high, that means there is more upside convexity than downside convexity, and vice versa.
Market Implications
- If upside convexity is high and increasing (Net GEX is very positive), and bars are relatively equal, a squeeze is likely. If upside convexity is high and rising, and a single bar above price predominates, look for reversion there.
- If downside convexity is low and decreasing (Net GEX is very negative), and bars are relatively equal, a selloff is likely. If downside convexity is low and decreasing, and a single bar below price predominates, look for reversion there.
- Reading Net GEX in tandem with Net Convexity can be quite powerful. It can tell you at a glance whether there is more gamma exposure bought or sold as calls or puts.