dex ladder
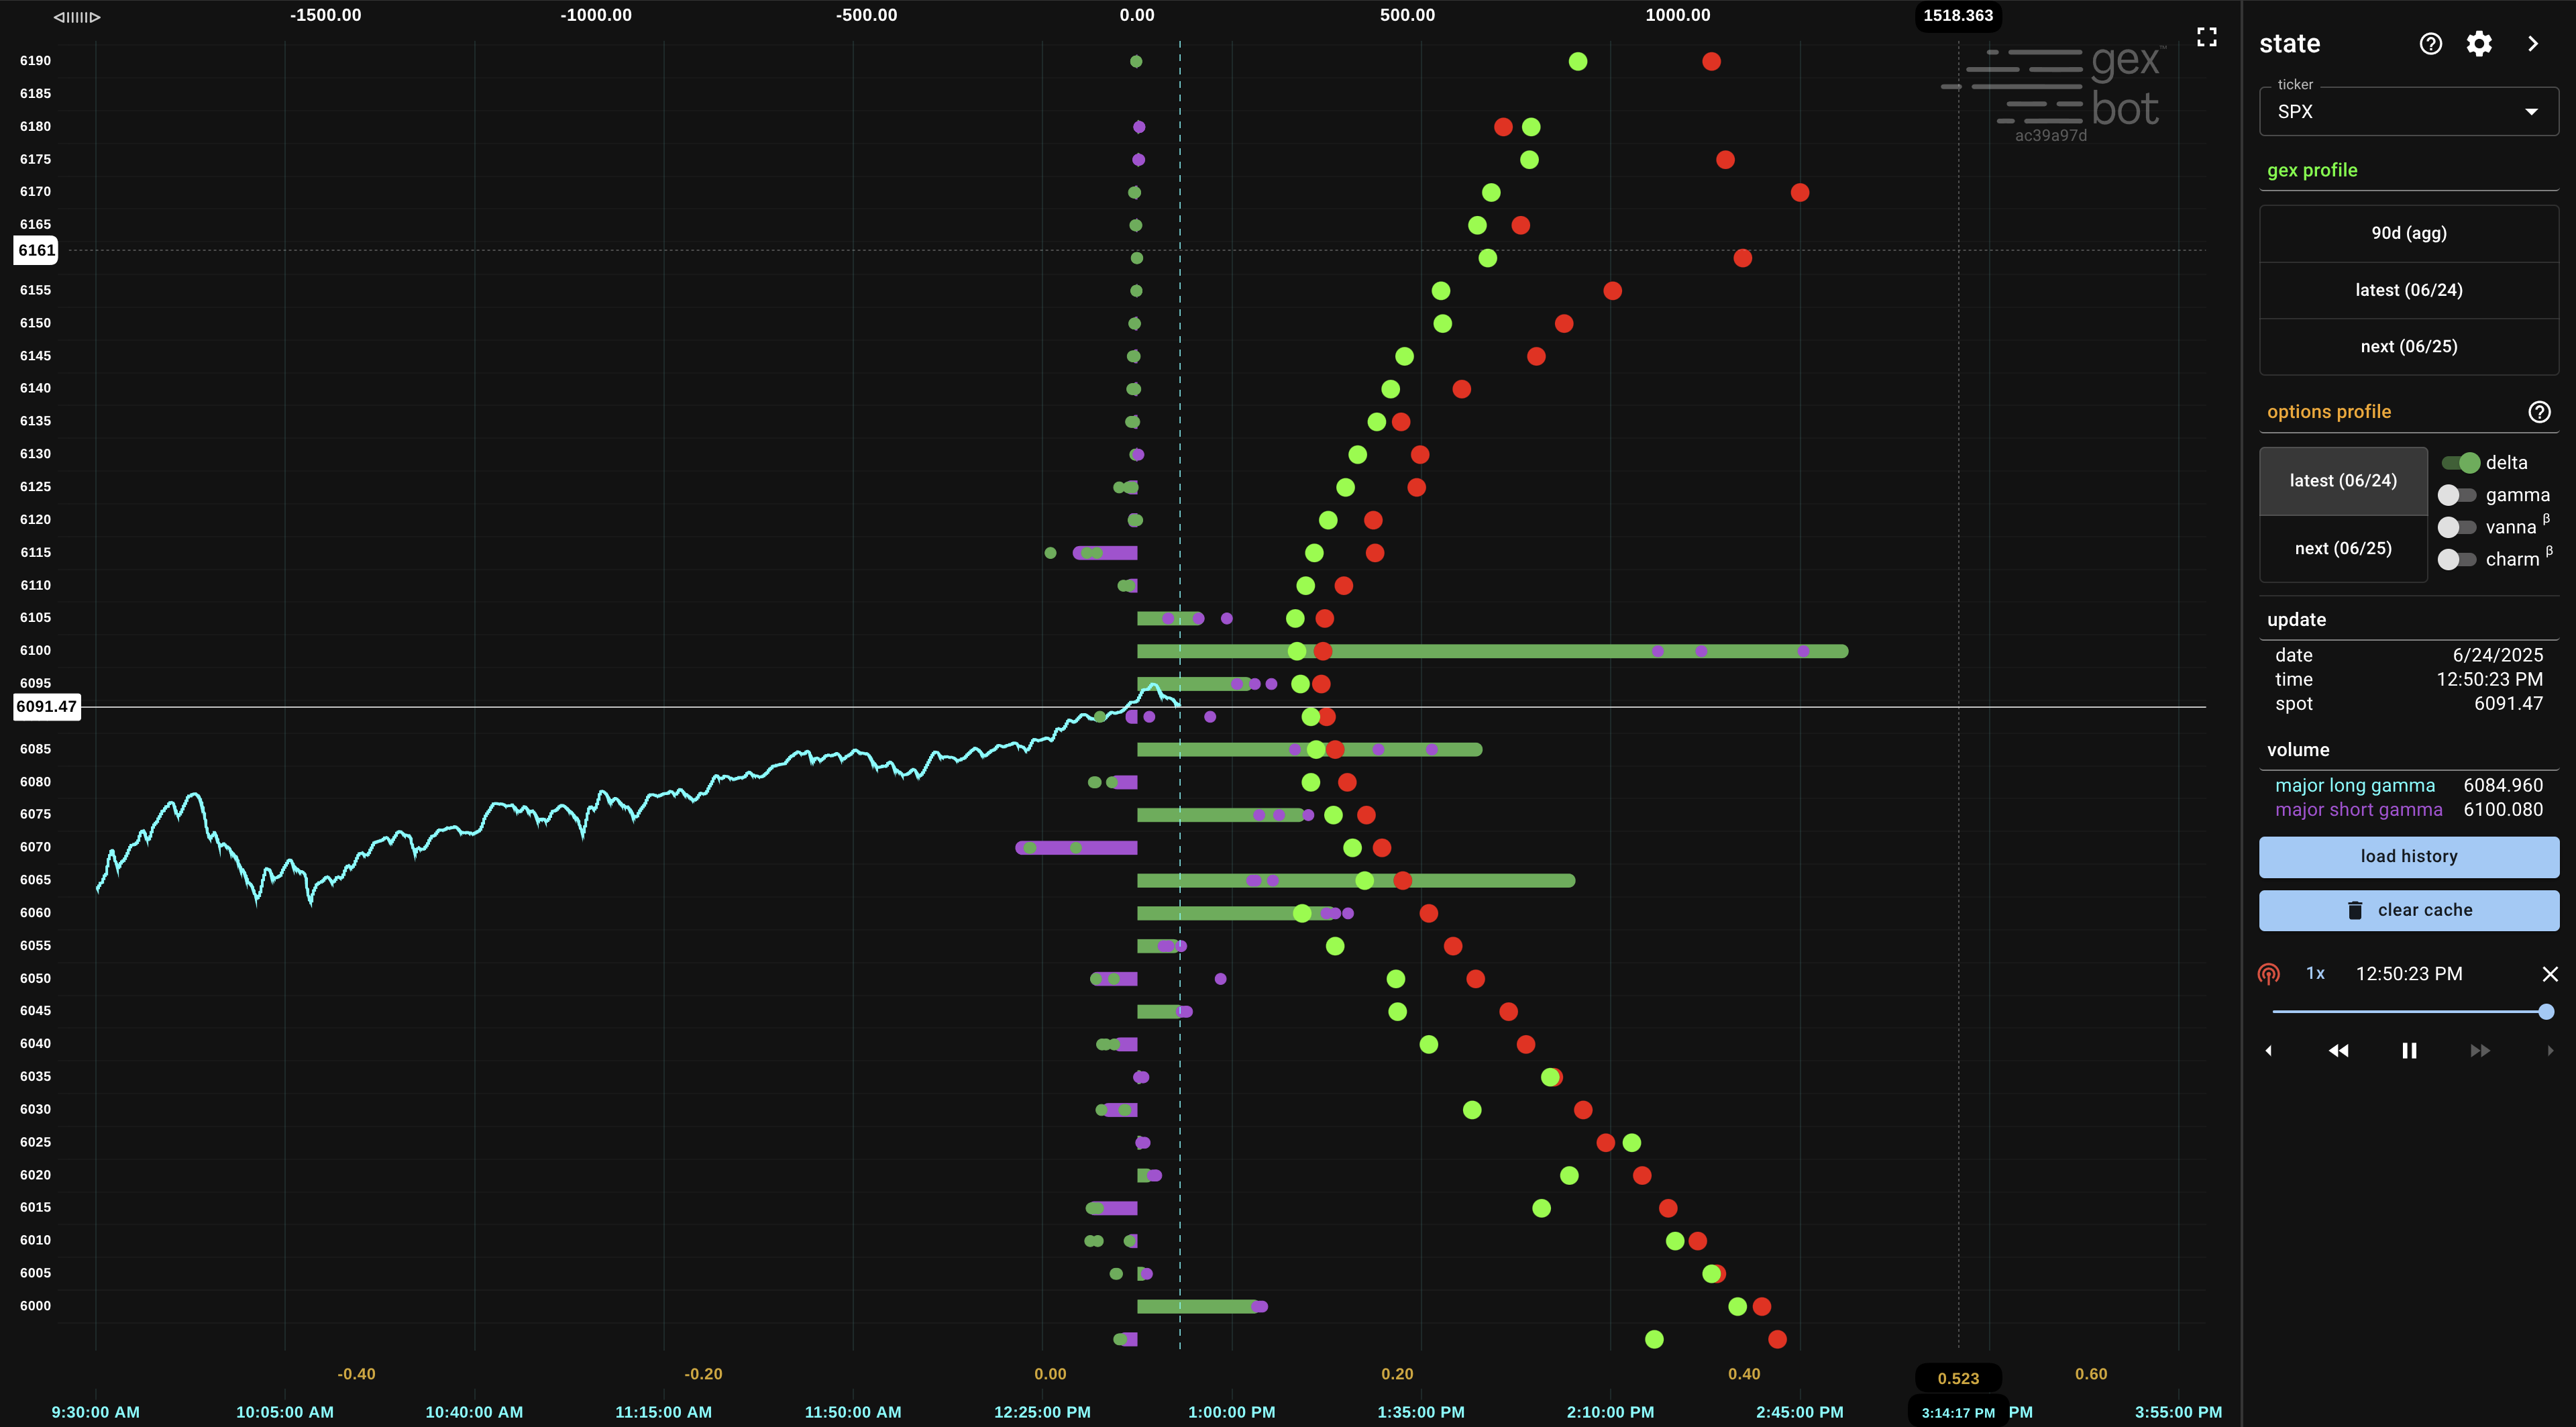
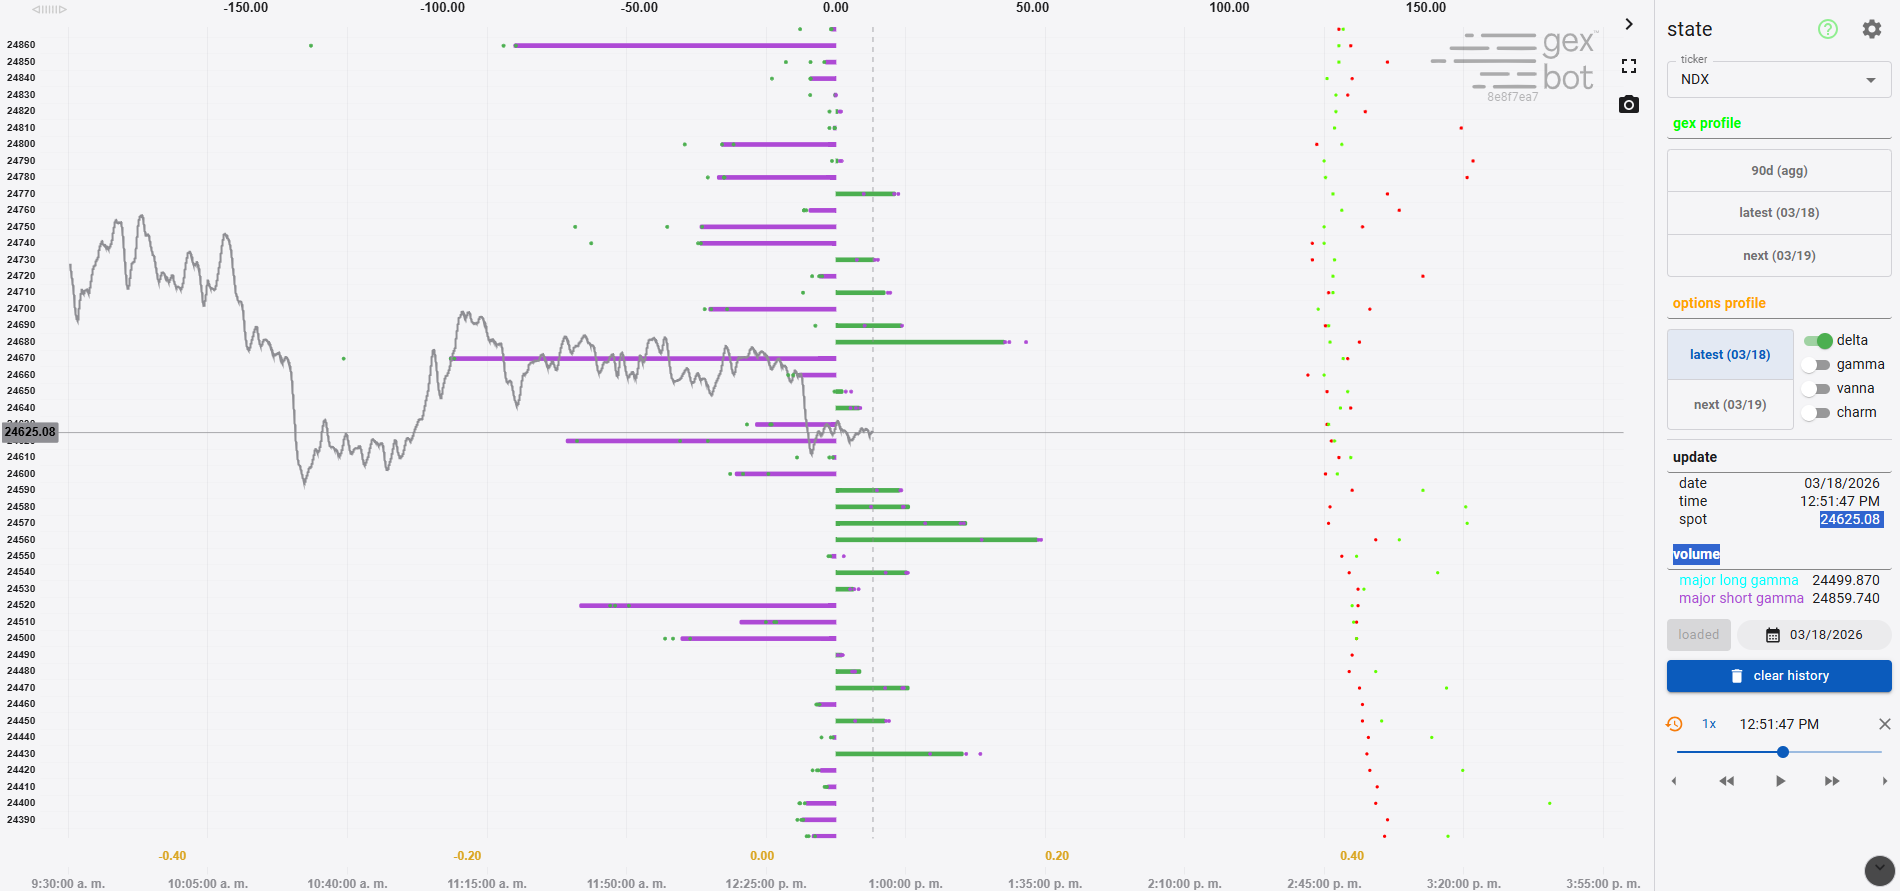
Strike-by-strike delta exposure derived from cumulative classified transaction imbalances.
API Endpoints
Access this data from the Options Profile Greeks API endpoint (greek delta).
Options profile can be a lot of information to take in at once. The dex ladder takes the net imbalance of transactions so far that day and displays the delta exposure at each strike.
Taker long calls and short puts have positive delta, while taker short calls and long puts have negative delta. Instead of having two bars per strike, DEX allows us to have one.
It shows us where participants are short, where they are long, and by how much. We can anticipate which levels will be heavily defended, and which levels will be decisive once overcome. Transition points between heavy short interest and traders attempting longs, for instance, signal targets and possible reversion zones.
The Options Version of the Order Book
The dex ladder is the options version of the current order book. Heavy short interest coming in above spot is a warning sign (much like a passive limit seller coming in above spot), just as heavy long interest (passive limit buyer) coming in below can be supportive.
Developing a Directional Bias
On underlyings, like SPY, for which options are most often traded directionally, a glance at the dex ladder can also be a quick way of developing a bias: How aggressively are traders positioned today?
High-Volatility Dynamics
One additional advantage is worth noting: In higher volatility environments, the gamma curve flattens out, strengthening the relationship between dex and price movement. More simply, the delta of a transaction becomes increasingly relevant as liquidity dries up. Accordingly, we rely more on dex as things heat up.