options profile
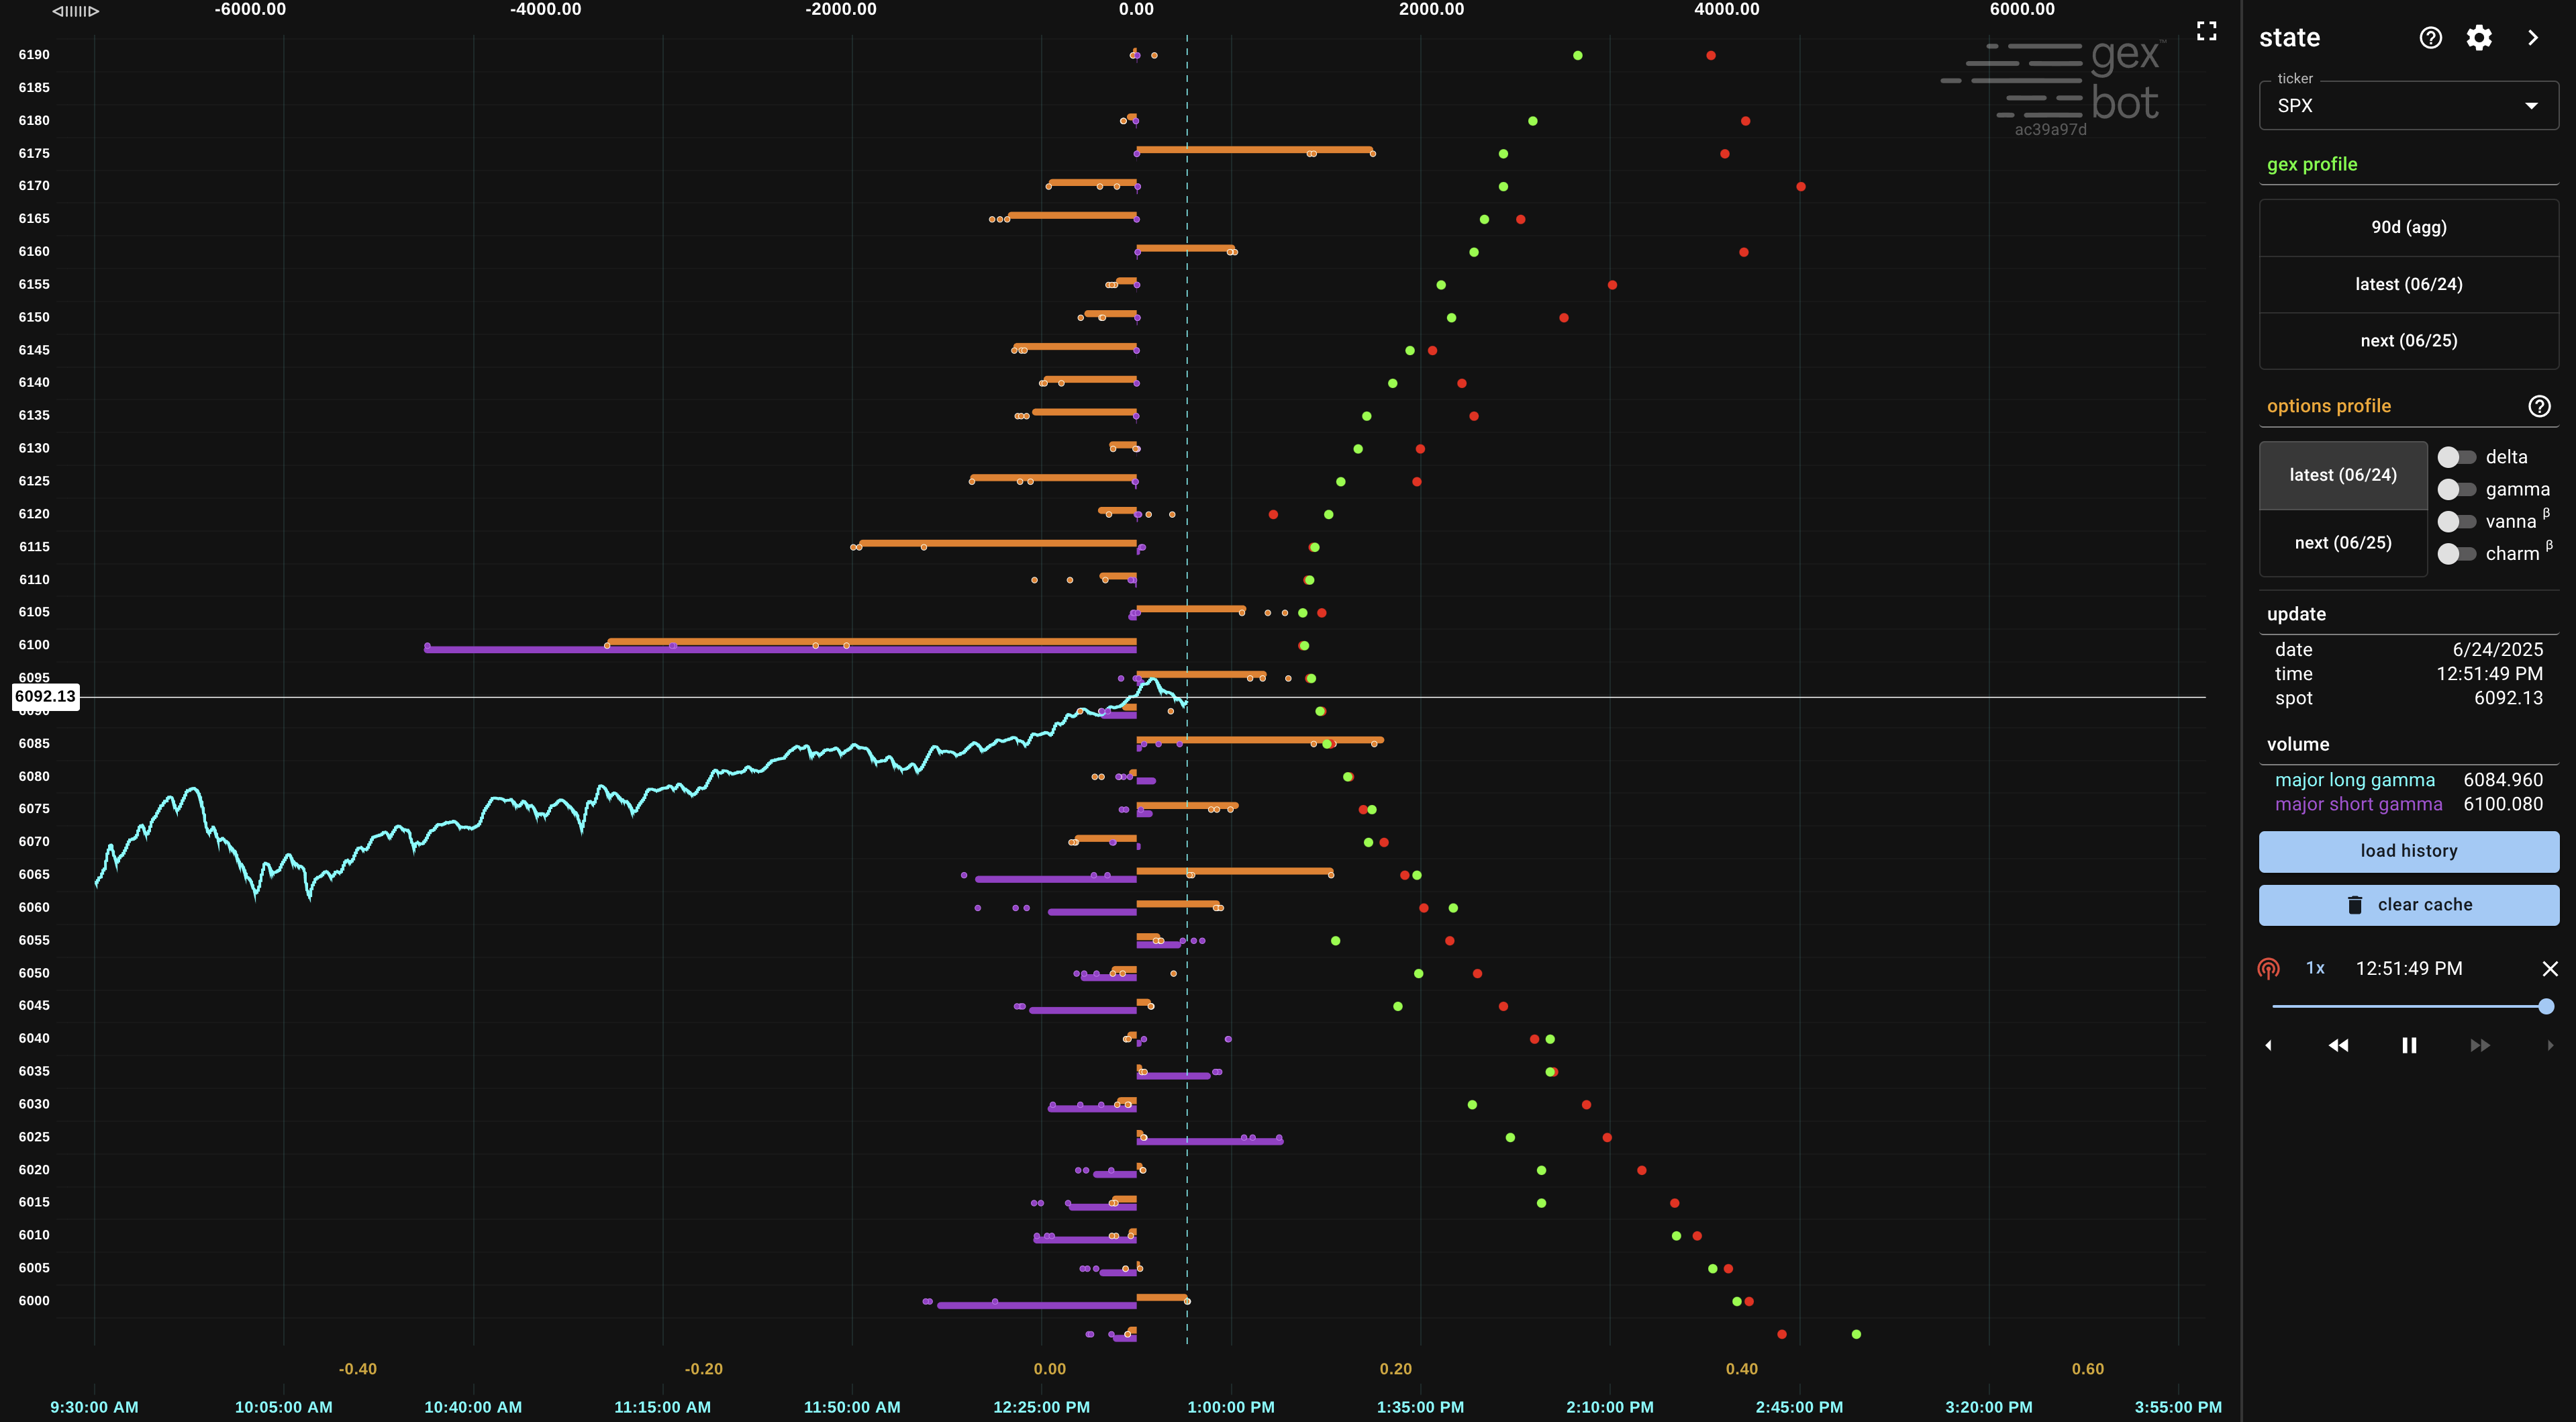
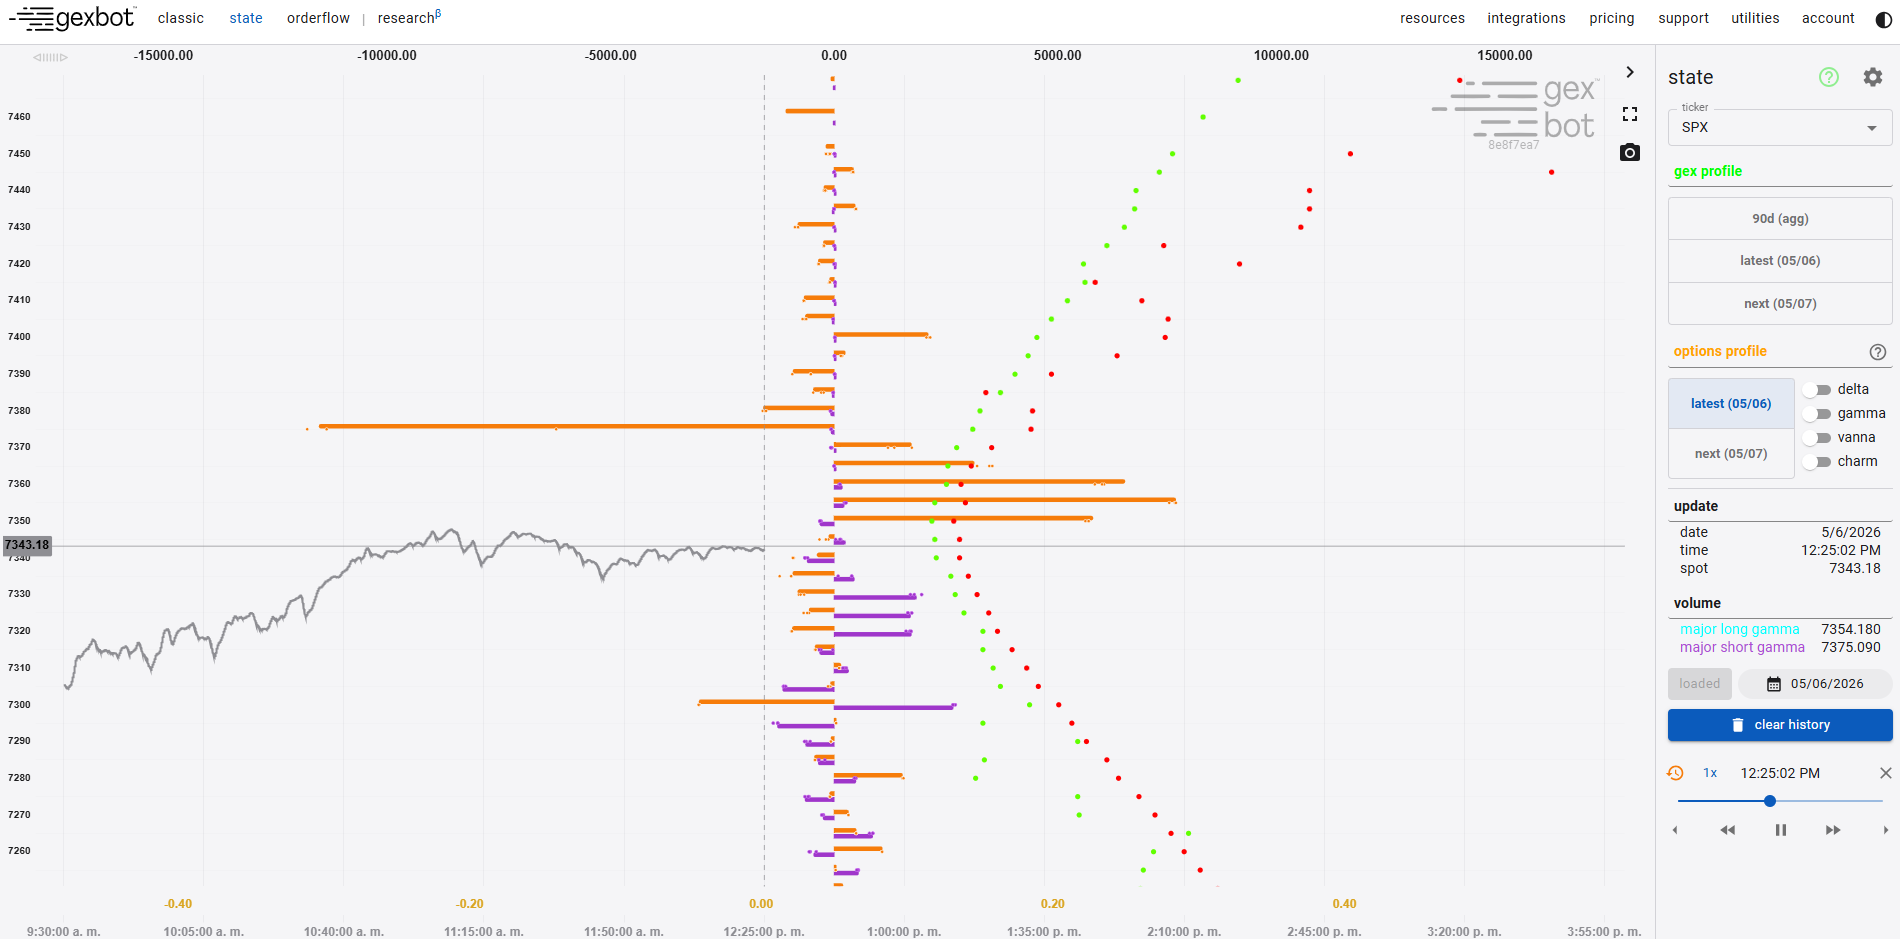
The results of our orderflow-classification engine — taker long vs short options, with 0DTE volatility skew.
API Endpoints
Get this data from the Options Profile Greeks API endpoint.
Description
Our options profile displays the results of our orderflow-classification engine. Options profile is available for the latest expiry (latest / 0 DTE) and the following one (next / 1 DTE). Our classification distinguishes between taker long options and taker short options. We do not distinguish between orders to open and orders to close.
- Puts default to purple.
- Calls default to orange.
- Taker Long options extend to the right (positive).
- Taker Short options extend to the left (negative).
The applicable features of gexbot classic (lookback dots, history slider) are included here too, with classified volume data as the backbone.
To view the options profile through other Greek dimensions, see the DEX Ladder, Convexity Ladder, and -Vanna/Charm Ladder pages.
0DTE Volatility Skew Dots & Expected Move
One feature that differs from classic is the addition of 0DTE volatility skew. The red and green dots on the chart represent the implied volatilities of puts and calls respectively. The skew axis is a secondary X-axis which can be found at the top of the chart.
- Expected Move (±1σ): A dashed horizontal boundary displays the 1-standard-deviation statistical expected price range:
Expected Move = Spot × Smoothed ATM IV × √(DTE_fractional / 365)- 3-Strike ATM Smoothing: Uses a weighted average (
50% ATM + 25% ATM_-1 + 25% ATM_+1) to eliminate quotation anomalies. - Fractional Intraday DTE: Calculated dynamically using remaining trading seconds until 4:00 PM ET (
seconds_remaining / 86400).
- 3-Strike ATM Smoothing: Uses a weighted average (
- Real-Time Streaming: State charts update continuously throughout market hours (9:30 AM–4:00 PM ET) as incoming options transactions are classified and aggregated.
Reading the Options Profile
The very first thing to keep in mind is that significant strikes represent areas of concentrated liquidity. As such they represent "stops" on our roadmap. But what about direction?
If takers are long, they are incentivized to exit those positions. If takers are short, they are incentivized to maintain their positions, as theta decay and volatility compression will bleed value out of their short contracts.
For the poker fanatics out there: Holding on to long contracts is -EV (expected value), whereas holding on to short contracts is +EV over the long run. This has a very specific effect:
- Long options act like walls: As price gravitates toward them, buyers are likely to take profits and liquidate, providing liquidity and stalling movement.
- Short options create squeeze risk: As price gravitates toward them, sellers face asymmetric risk and may need to cover or hedge, removing liquidity and increasing the likelihood of continuation.
Volatility Environment
One additional variable is worth mentioning here: volatility.
- As volatility rises, contract prices rise too.
- As volatility compresses, contract prices fall. The above holds in a declining volatility environment (which is the most common).
- A rising volatility environment, however, decreases the incentive to exit long options positions, making walls more vulnerable.
- A rising volatility environment does not alter (and may even increase) the incentive to hold on to short options positions. Sellers are being paid more to hold on, as volatility premiums rise.
- Often, sellers will even add to their short inventory as we approach a short strike. Thus, in a rising volatility environment, short options are more likely to act as walls.