ATAS & ATAS X integration
Install the official gexbot plugins for ATAS desktop and ATAS X, and configure every setting.
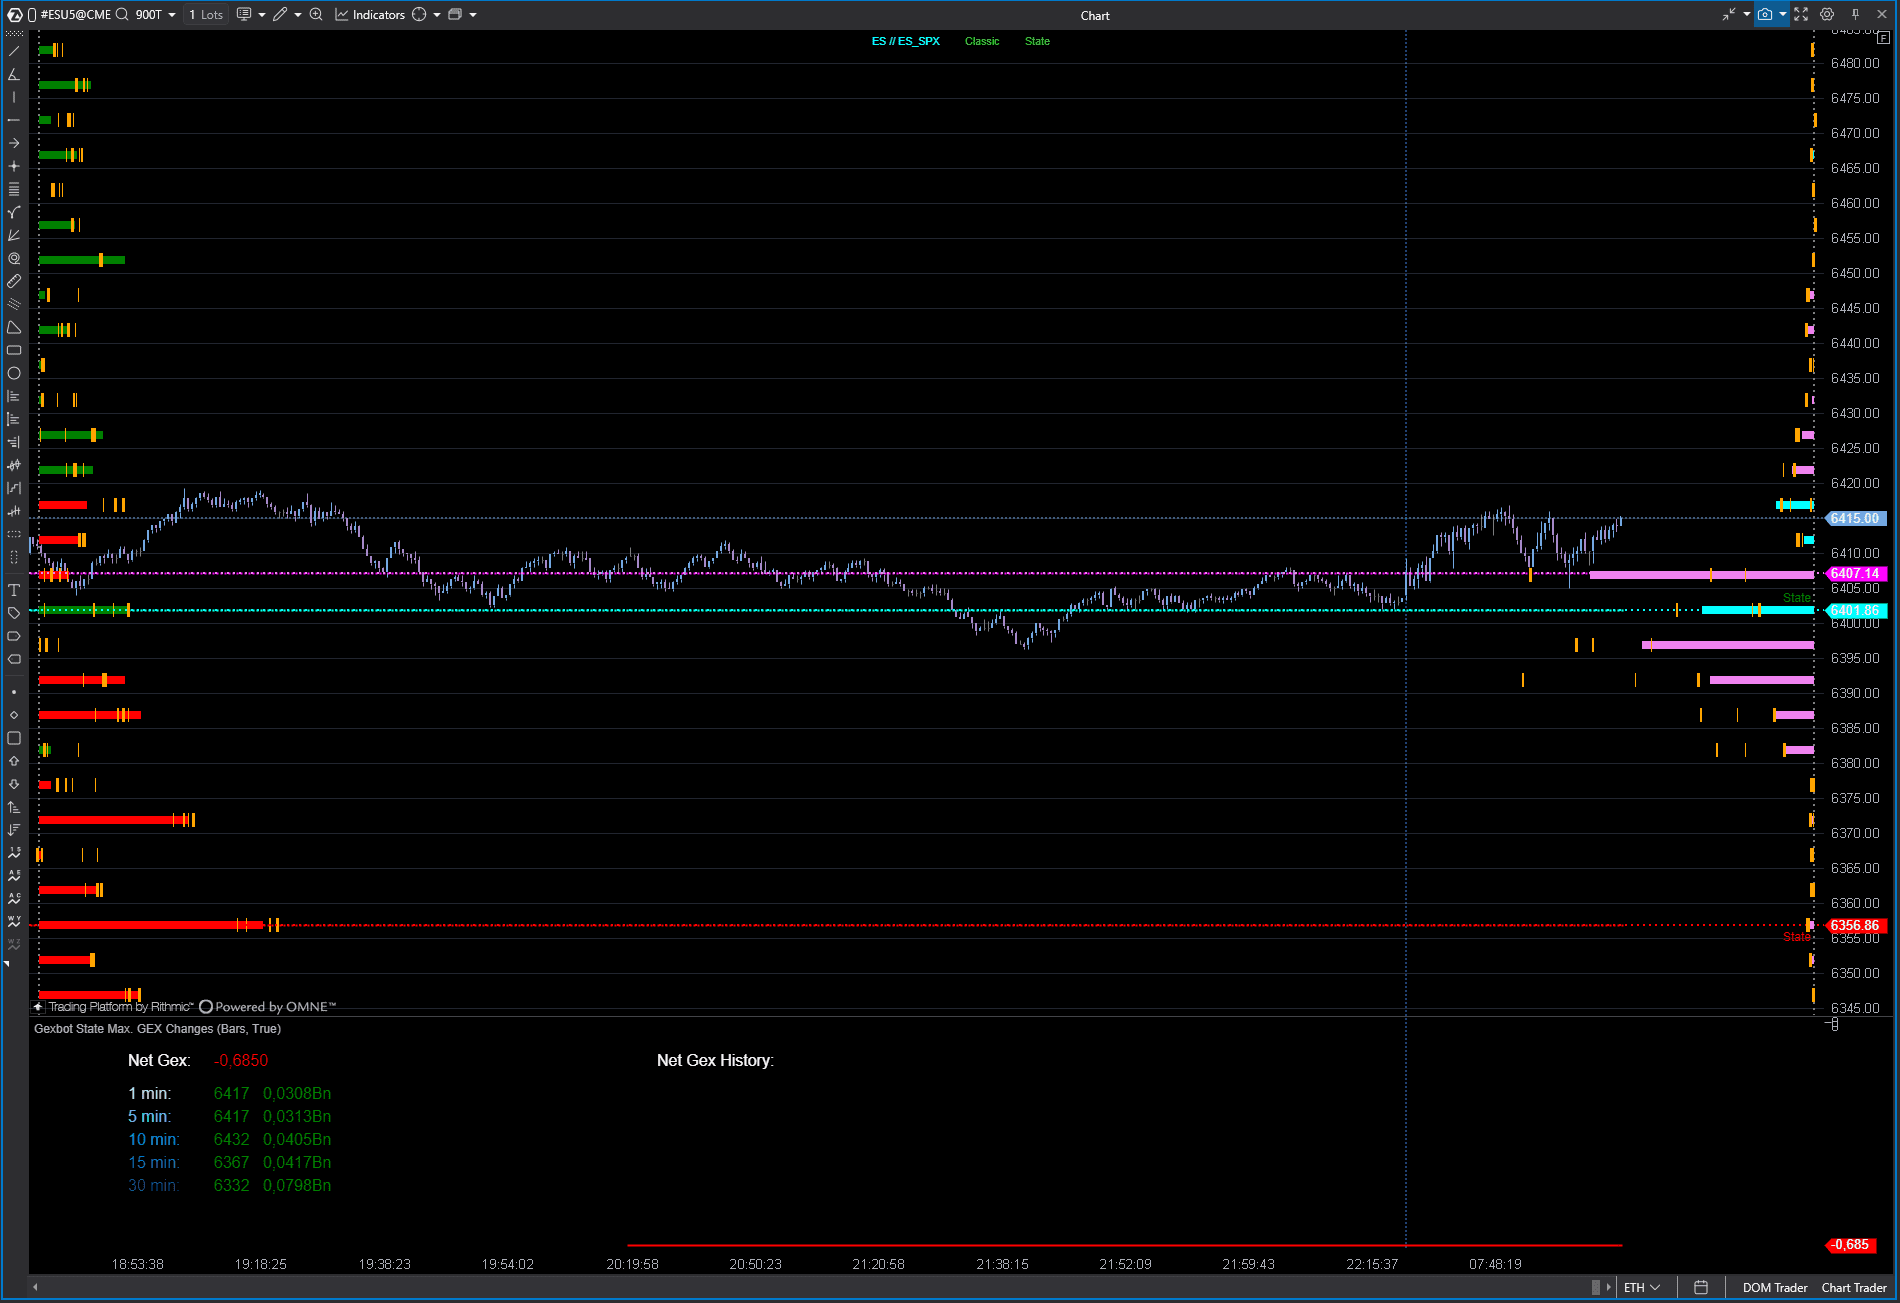
The gexbot ATAS & ATAS X plugins bring options-driven GEX ladders, Greek profiles, major levels, and live streaming orderflow directly onto your ATAS chart. Each package ships two indicators:
gexbotdocuments the GEX and Greek profiles, the major levels, the historical majors, and the automatic futures conversion. This is the main indicator, documented below.gexbot Orderflow Liveis a companion indicator that streams sub-second GEX, DEX, and Convexity flow imbalances over WebSocket. It has its own settings, documented in its own section below.
Requirements
- You need an active gexbot subscription with API access.
- You need your API key. Copy it from Connections. ATAS and ATAS X use the same key, so you do not need to generate a separate one for each platform.
ATAS and ATAS X are not interchangeable
The plugin build for ATAS Standard and the plugin build for ATAS X are two different files. A DLL built for one platform will not load, or will not work correctly, in the other. Make sure you download the build that matches the platform you are running.
Download
Download Gexbot_V3.6_ATAS_2026_09_22.rarThis package is built for ATAS Standard. You can also find it on the official gexbot Discord.
Install
Open the Indicators panel
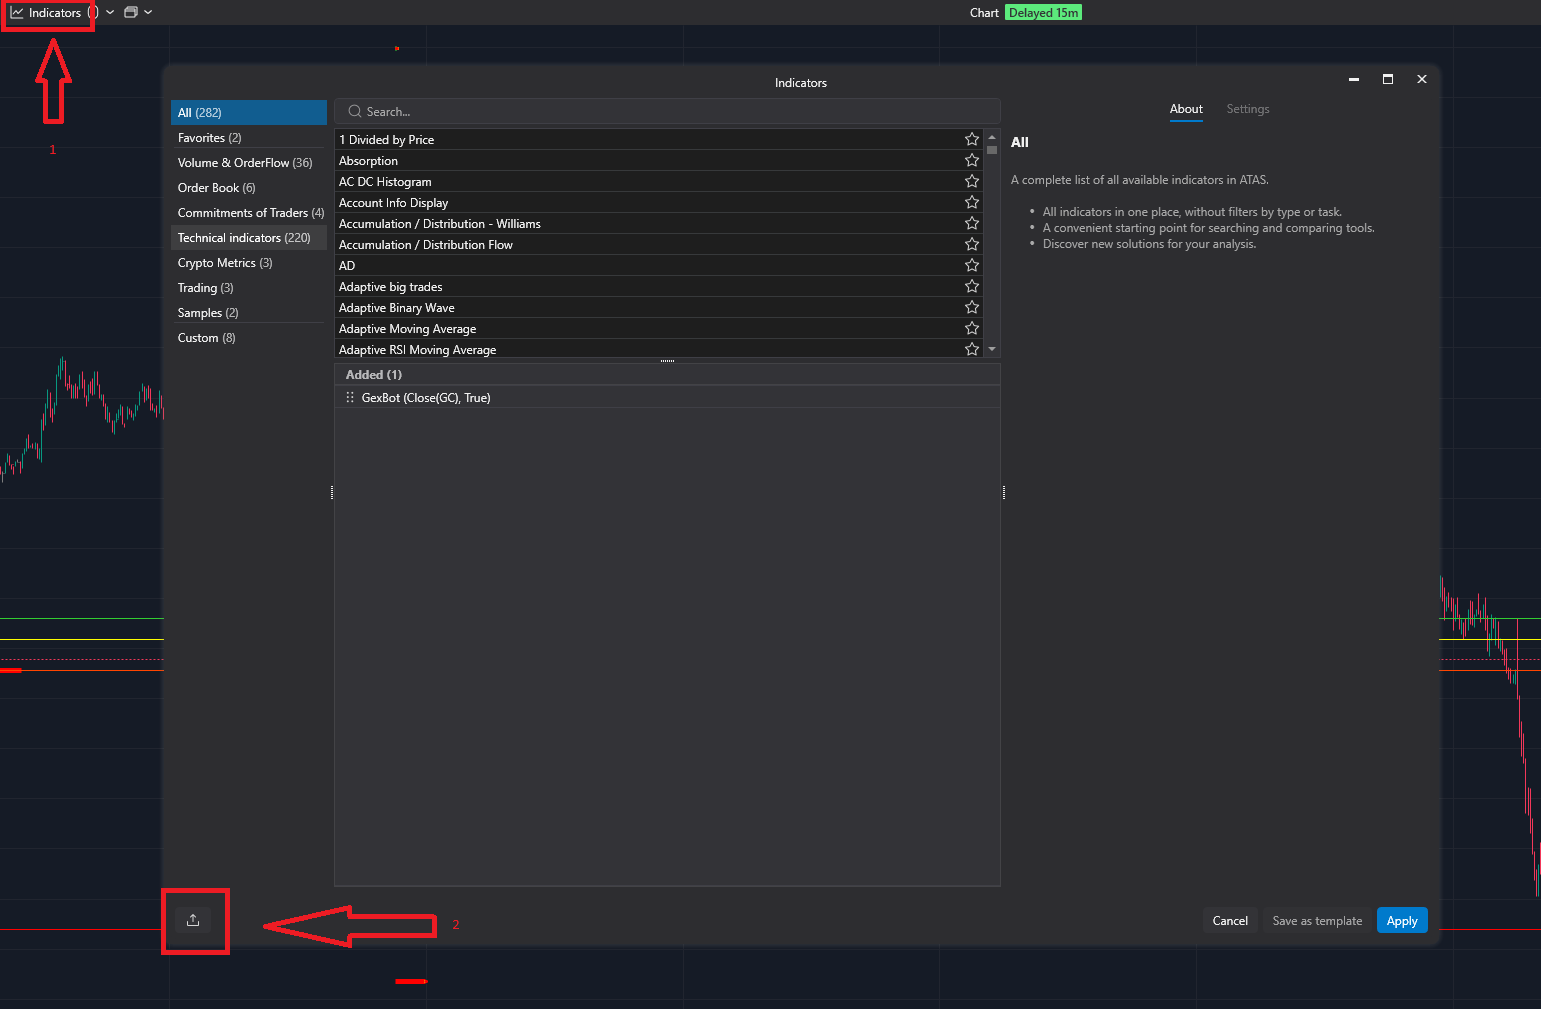
In ATAS, open your chart and click the Indicators icon, or press Ctrl+I.
Import the DLL
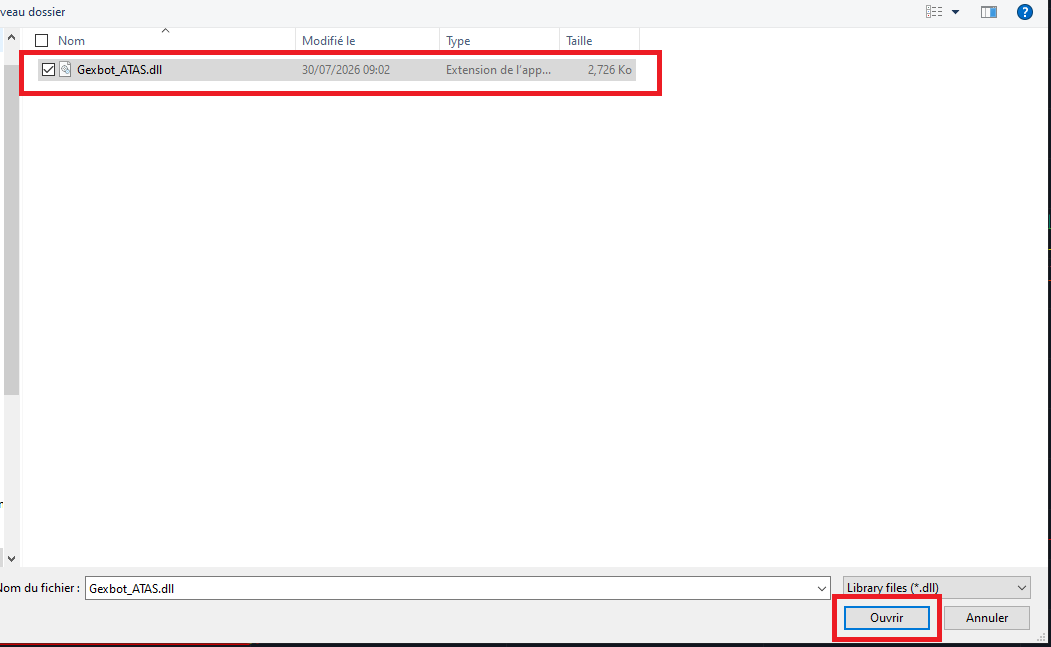
Click the import icon in the lower-left corner of the Indicators window and select the extracted .dll file. If Windows blocks the file, right-click it, open Properties, check Unblock, and click Apply before importing again.
Find gexbot in the list
Search for GexBot in the Trading category, or use the search box. Star it to add it to your Favorites for quick access next time.
Add it to your chart
Select it and click Add. It appears under Added, linked to the chart's instrument, for example GexBot (Close(ES), True).
Configure it
Open its Settings tab and paste your API key first. Nothing else works without it. Leave Refresh Interval at its default of 1 second for the first run, then continue with the Configuration tab above.
Download
Download Gexbot_V1.3_ATAS_X_2026_09_22.rarThis package is built for ATAS X, the Avalonia-based platform. You can also find it on the official gexbot Discord.
ATAS X uses the same ATAS API key as the classic ATAS version. You do not need to generate a new one.
Install
Open the Indicators panel
In ATAS X, open your chart and click the Indicators icon.
Import the DLL
Click the import icon in the lower-left corner of the Indicators window and select the extracted .dll file.
Find gexbot in the list
Search for GexBot in the Trading category, or use the search box. Star it to add it to your Favorites for quick access next time.
Add it to your chart
Select it and click Add. It appears under Added, linked to the chart's instrument, for example GexBot (Close(ES), True).
Configure it
Open its Settings tab and paste your API key first. Nothing else works without it. Leave Refresh Interval at its default of 1 second for the first run, then continue with the Configuration tab above.
Nothing showing up on your chart?
If the indicator loads but no profile or level appears, see Nothing is showing up on my chart in the FAQ tab above before contacting support.
gexbot on ATAS and gexbot on ATAS X share the same configuration schema. Every setting below applies to both plugins, unless the section says otherwise.
API Settings
| Setting | What it does |
|---|---|
| API Key | Your gexbot API key. Paste it in first. Nothing else works without it. |
| Ticker | The symbol requested from the API, for example SPX. It is independent from the chart's own symbol, so you can show SPX levels on an ES chart, especially when combined with Futures Conversion below. |
| GEX Model | Which GEX dataset to display. Classic (Naive GEX) combines Volume and Open Interest. State (Classified GEX) uses Volume only, from classified data. State 0DTE / 1DTE Gamma Profile shows the gamma Greek only, for options expiring today or tomorrow. State 0DTE / 1DTE Delta Profile shows the delta Greek only. The Profile modes always show a single Greek, never combined with GEX. |
| Aggregation Period | The time window used for the data. 90d (full) is a 90-day aggregate. 0DTE (zero) covers options expiring today. Next (one) covers the next expiration, or 1DTE. This setting affects both the live profile and the live major levels. |
| Refresh Interval (sec) | How often live data refreshes, from 1 to 300 seconds. Keep this at 1 second unless you have a specific reason to slow it down. A high value can make the indicator look stuck on "Loading" right after you add it, simply because it is waiting for its first refresh. |
Futures Conversion
Step-by-step guide
The Plot levels on futures charts page explains how to set up the automatic conversion from start to finish: which Ticker and Futures Target to combine, what to check on the chart, and what to do when levels do not line up.
| Setting | What it does |
|---|---|
| Futures Target | The target futures contract for automatic price conversion, for example ES or NQ. Leave it blank to disable conversion, so levels stay on the Ticker's own scale. |
| Multiplier (auto) | Calculated automatically by the API to convert to the target contract. You can edit it manually to override the value, but it will be overwritten on the next automatic refresh. |
| Additive / Premium (auto) | Calculated automatically, for example the basis between SPX and the ES future. You can edit it the same way as the multiplier. |
| Show Conversion Info | Shows the source ticker, the resolved contract, the multiplier, and the additive on the chart. Use this to confirm the conversion is working as expected. |
Futures rollover
Conversion refreshes automatically at startup, at 9:30 and 9:32 AM ET, and every 15 minutes after that, so basis offsets stay current through the trading day without manual intervention.
Strike Transform
| Setting | What it does |
|---|---|
| Strike Multiplier | An extra manual multiplier applied to every strike, on top of the automatic futures conversion above. |
| Strike Additive Offset | An extra manual offset, applied the same way. |
Most users leave these at their defaults of 1 and 0. They exist for fine-tuning beyond the automatic conversion, and are not required for normal use.
GEX Volume Profile
| Setting | What it does |
|---|---|
| Show GEX Volume Profile | Toggles the Volume-based GEX profile, drawn as bars per strike. |
| Profile Width (% of canvas) | The maximum bar length, as a percentage of chart width. |
| Bar Alignment | The direction bars grow from their origin. Left, Right, or Center (Split), where positive values grow to the right and negative values grow to the left of a center point. |
| Origin Position (% of canvas) | The horizontal position of the bars' origin point, as a percentage of chart width. |
| Call GEX Color / Put GEX Color | The bar colors for call (positive) and put (negative) strikes. |
| Bar Thickness (px) | The bar thickness, in pixels. |
This profile drives the volume major lines
The Pos Vol, Neg Vol, and Zero Gamma major lines, described in the Major Lines section below, only draw while Show GEX Volume Profile is enabled. If you turn this profile off, those lines disappear too, even if their own Show Line setting is still checked.
GEX OI Profile
This profile has the same settings as the GEX Volume Profile, but it is based on Open Interest instead. It is independent, so you can show it alongside the Volume profile, for example with Volume aligned left and OI aligned right, for an at-a-glance comparison.
| Setting | What it does |
|---|---|
| Show GEX OI Profile | Toggles this second profile. |
| Profile Width / Bar Alignment / Origin Position | The same controls as the Volume profile, adjustable independently. |
| Call OI Color / Put OI Color | Dedicated colors, different from the Volume profile by default so the two are easy to tell apart. |
| Bar Thickness (px) | The OI bar thickness. |
Greek Profile
This profile uses the same layout controls as the two GEX profiles above, but it plots a single Greek, either gamma or delta. It is only relevant when GEX Model is set to one of the State Profile options.
| Setting | What it does |
|---|---|
| Show Greek Profile | Toggles the Greek profile. |
| Profile Width (% of canvas) | The maximum bar length, as a percentage of chart width. |
| Bar Alignment | The direction bars grow from their origin. Left, Right, or Center (Split). |
| Origin Position (% of canvas) | The horizontal position of the bars' origin point, as a percentage of chart width. |
| Long Color / Short Color | The bar colors for the long (positive) and short (negative) side of the Greek. |
| Bar Thickness (px) | The bar thickness, in pixels. |
This integration does not expose classified call and put volume as separate series, and it does not plot implied-volatility skew dots. Both of those are available on the gexbot web app only.
Major Lines
gexbot can draw up to seven horizontal reference lines across the chart, each marking a key level. Every line has the same six controls.
| Setting | What it does |
|---|---|
| Show Line | Toggles that line on or off. |
| Color | The line's color. |
| Thickness | The line thickness, from 1 to 10. |
| Style | The line style, either solid or dashed. |
| Show Label | Toggles the price label shown at the end of the line. |
| Label Position | Where the label sits relative to the line, either Left or Right. |
The seven available lines are listed below.
| Line | Plots | Available in | Default color |
|---|---|---|---|
| Pos Vol | The major positive Volume GEX level | GEX Volume Profile | Lime Green |
| Neg Vol | The major negative Volume GEX level | GEX Volume Profile | Red |
| Zero Gamma | The zero gamma flip level | GEX modes | Yellow |
| Pos OI | The major positive Open Interest GEX level | Classic model only | Lime |
| Neg OI | The major negative Open Interest GEX level | Classic model only | Orange Red |
| Long Greek | The major long gamma or delta level | State Greek Profile modes | Aqua |
| Short Greek | The major short gamma or delta level | State Greek Profile modes | Medium Purple |
Pos OI and Neg OI only apply when GEX Model is Classic. Open Interest data does not exist in State mode, so these two lines have nothing to plot there.
GEX Prior Dots
These are small dots plotted at each strike, showing how its GEX value has changed over the last few minutes. They give you a quick way to see where GEX is building up or fading, without waiting for the next refresh.
| Setting | What it does |
|---|---|
| 1 / 5 / 10 / 15 / 30 Min Color | The dot color for each lookback window, meaning how far back that dot's change is measured. |
| 1 / 5 / 10 / 15 / 30 Min Size | The dot size for each lookback window, from 0 (hidden) to 15. |
Greek Prior Dots
This works the same way as GEX Prior Dots, but for the Greek profile, gamma or delta. It is only relevant in State Profile modes.
| Setting | What it does |
|---|---|
| Show Greek Prior Dots | Toggles this layer on or off. |
| 5 / 15 / 30 Min Color | The dot color for each lookback window. |
| 5 / 15 / 30 Min Size | The dot size for each lookback window, from 0 (hidden) to 15. |
Historical Majors
| Setting | What it does |
|---|---|
| Show Historical Levels | Fetches and draws the day's historical major levels with one API call. Enable this on only one gexbot instance per chart, to avoid redundant calls. |
| Show Live History | Appends the current live major levels to the historical line in real time, at no extra API cost. |
| Historical Aggregation Period | The 0DTE, 1DTE, or 90d aggregation used specifically for the history fetch. This is independent from the live Aggregation Period in API Settings. For example, you can watch a 1DTE live profile while the historical line still reflects 90d data, or the other way around. |
| Historical Pos Color / Historical Neg Color / Historical Zero Color | The colors for the positive, negative, and zero-gamma historical marks. |
| Dot Width (px) | The thickness of the small horizontal mark drawn on each bar to show that bar's historical level. It is not a continuous line connecting bars together, but one short tick per bar. |
Status
| Setting | What it does |
|---|---|
| Show Status Text | Toggles the small on-chart status readout. It shows the indicator name, the ticker, the model, the futures conversion info when enabled, and a connection message such as "Loading", "OK", or an error. It does not show a Net GEX value. |
Hotkeys
| Setting | What it does |
|---|---|
| Toggle Profile Visibility | A keyboard shortcut that shows or hides the whole gexbot overlay without removing the indicator. The default key is Q. |
gexbot Orderflow Live
gexbot Orderflow Live is a separate, companion indicator. It streams a live orderflow metric over WebSocket and plots it as a histogram, independent of the chart's timeframe or bar type, including Renko and other non-time-based bars.
| Setting | What it does |
|---|---|
| API Key | Your gexbot API key. The same key used by the main gexbot indicator works here too. |
| Ticker | The symbol to stream. The list includes the major indices and futures (SPX, VIX, NDX, RUT, ES_SPX, NQ_NDX) along with a fixed set of individual stocks, for example AAPL, TSLA, NVDA, SPY, and QQQ. |
| Metric | Which flow to plot: Gex, Dex, or Convexity. |
| DTE | Whether the metric is calculated for options expiring today (0DTE) or the next expiration (1DTE). |
| Debug Mode | Logs extra diagnostic information for troubleshooting. Leave this off for normal use. |