Quantower integration
Install and configure the official gexbot indicator plugin for Quantower.
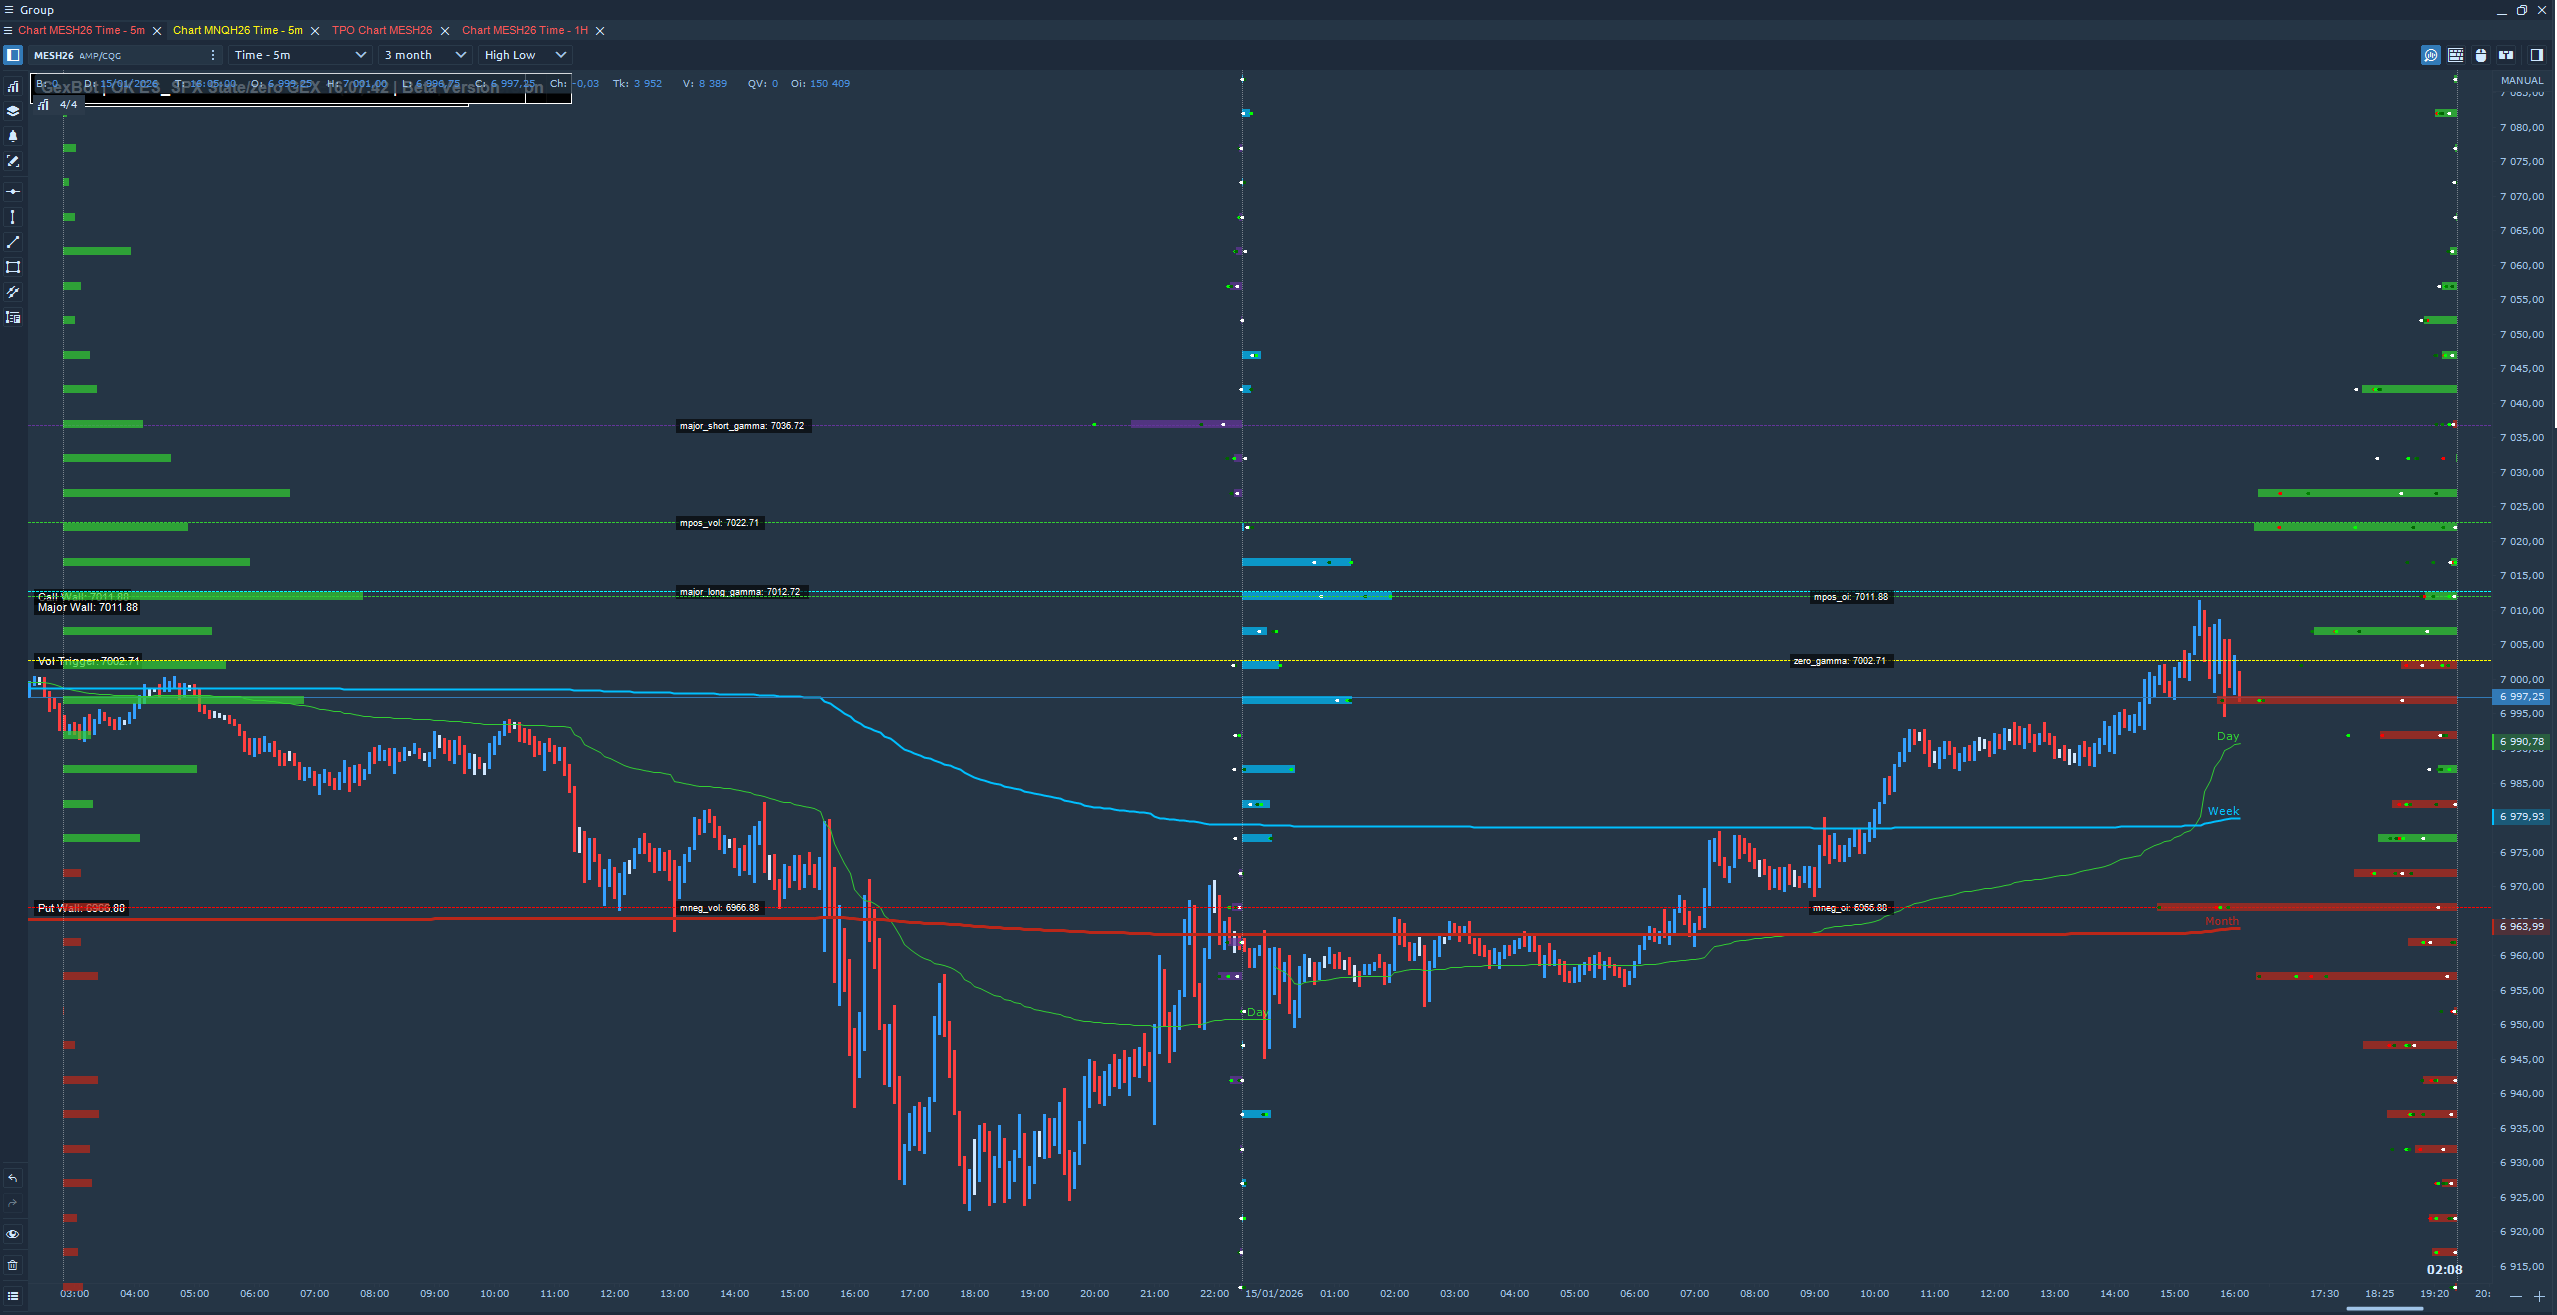
The gexbot Quantower indicator renders GEX and Greek profiles, major levels, prior-change dots, and historical majors directly on your Quantower chart. A companion GexBot Orderflow Live indicator streams live GEX, DEX, and Convexity impulses over WebSocket in a separate chart window. It is only included in the standard build, not in the AMP Futures build. See the GexBot Orderflow Live section below.
Requirements
- You need an active gexbot subscription with API access.
- You need your API key. Copy it from Connections.
Two builds, same indicator
gexbot ships a standard build (GexBot.dll) and a separately named AMP Futures build (GexBotAMP.dll), so the two can never collide if a Quantower install already has one of them. Both builds have identical settings and behavior. Use the AMP build if you run Quantower through AMP Futures, and the standard build otherwise.
The AMP build does not include Orderflow Live
The AMP build is intentionally a smaller package. It ships the main GexBot indicator only, without the GexBot Orderflow Live companion. Two of that companion's dependencies are not compatible with the AMP Futures environment, so they were left out of this build entirely. Everything else documented on this page works the same in both builds. If you need the Orderflow Live indicator, use the standard build.
Close Quantower
Make sure Quantower is completely closed before copying indicator files.
Remove any older copy first
If you are updating from a previous version, delete the old .dll file, and any of its support files, from the Indicators folder before copying the new one in. Leaving an old copy in place alongside the new one is a common cause of the indicator failing to load or showing the wrong version.
Download the indicator
Download the package for your build. A newly released build is sometimes posted on the official gexbot Discord before the website download link is updated, so check Discord first if you are looking for the very latest version. If Windows blocks the .dll files, right-click each one, open Properties, check Unblock, and click Apply.
Copy it into the Scripts folder
Copy the extracted folder, meaning the .dll plus its support files, into Quantower's Indicators folder.
C:\Quantower\Settings\Scripts\Indicators\GexBot\Use ...\Indicators\GexBot_AMP\ instead for the AMP build.
Launch Quantower and add it
Open a chart, click the Indicators icon, search for GexBot, or for GexBot Orderflow Live if you want the streaming companion, and add it.
Configure it
Open its settings and paste your API Key first. Nothing else works without it. Then continue with the Configuration tab above.
Multiple instances
If you run more than one GexBot instance on the same chart, enable Show History Majors and Show Live History on only one of them. Each enabled instance makes its own API call.
Quantower shows every input below in a single settings list, ordered top to bottom. The groupings here are for readability only.
API & Data Source
| Setting | What it does |
|---|---|
| API Key | Your gexbot API key. Paste it in first. Nothing else works without it. |
| Ticker | The symbol requested from the API, for example SPX. It is independent from the chart's own instrument. |
| Futures Target (filled = auto, empty = manual) | The target futures contract for automatic price conversion, for example ES or NQ. Leave it empty to use the two manual fields below instead. |
| Manual Multiplier (used when Futures Target empty) | The fixed multiplier applied when no Futures Target is set. The default is 1.0, meaning raw index prices. |
| Manual Premium +/- (used when Futures Target empty) | The fixed additive offset applied when no Futures Target is set. The default is 0.0. |
| Type | Classic combines Volume and Open Interest GEX (Naive GEX). State uses classified orderflow, which is required for the Gamma and Delta options in Data below. |
| Aggregation | full is a 90-day aggregate. zero covers options expiring today (0DTE). one covers the next expiration (1DTE). |
| Data | GEX, or one of Gamma or Delta. The two Greeks require Type to be State. |
| Classic Profile: GEX Source | Only used when Type is Classic and Data is GEX. Draws the profile from Volume or from Open Interest (OI). |
| Refresh (seconds) | How often the live profile and majors refresh. |
Futures conversion cadence
When a Futures Target is set, the conversion refreshes automatically at startup, at 9:30 and 9:32 AM ET, and every 15 minutes after that, during the 9:30 AM to 4:00 PM ET session. This only gates the conversion. The main profile refresh above runs regardless of market hours.
Profile Layout
| Setting | What it does |
|---|---|
| Profile Width (px) | The maximum bar length, in pixels. |
| Bar Height (px) | The height of each strike's bar. |
| X Position from Right (px) | The horizontal distance from the chart's right edge to the profile's origin. |
| Direction | The direction bars grow from their origin: Left, Right, or Split, where positive values grow one way and negative values grow the other, from a center point. |
| Line Style | The style used for the profile bars and lines: Dash, Solid, or Dot. |
| Show Prior Dots | Toggles the prior-change dots described below. |
| Dot Size | The size of the prior dots. |
| Prior Dots Mode | Change makes the dot reflect the change since that lookback window. Absolute makes the dot reflect the prior value itself. |
| Prior Dots Scale | Dots auto-scales the dots independently. Profile scales them against the main profile's own scale. |
Level Labels
| Setting | What it does |
|---|---|
| Show Level Labels | Toggles the price or value label shown next to each plotted strike. |
| Label Position | Left or Right of the bar. |
| Label Padding X (px) | The horizontal gap between the bar and its label. |
| Label Offset Y (px) | A vertical fine adjustment of the label. |
| Avoid Label Overlap | Nudges overlapping labels apart automatically. |
| Min Label Gap (px) | The minimum vertical spacing enforced when Avoid Label Overlap is on. |
| Price Decimals | The number of decimal places shown in level labels. |
Major Levels
| Setting | What it does |
|---|---|
| Show Major + by Volume / Show Major - by Volume | Toggles the major positive and negative Volume GEX lines. |
| Show Zero Gamma | Toggles the zero gamma flip line. |
| Show Major + by OI / Show Major - by OI | Toggles the major positive and negative Open Interest GEX lines. These are only meaningful when Type is Classic. |
| Show Major + (Greek) / Show Major - (Greek) | Toggles the major positive and negative lines for the selected Greek. These are only meaningful when Data is Gamma or Delta. |
| Show Major Long Gamma / Show Major Short Gamma | Toggles the major long and short gamma lines. |
Status Text
This is an optional on-chart readout summarizing the current levels as text.
| Setting | What it does |
|---|---|
| Show Status Text | Toggles the readout. |
| Status Text Position | The Left or Right side of the chart. |
| Status X (px) / Status Y (px) | A fine position offset. |
| Status Font Size / Status Header Font Size | The text sizes for the values and for the section header. |
| Status Line Spacing (px) | The vertical spacing between lines. |
| Status Background / Status Background Alpha (0-255) | Toggles a background panel behind the text, and sets its opacity. |
| Status Text: Use Locale Formatting | Formats numbers using your system locale, for example thousands separators and decimal marks. |
| Status Text: Value Decimals | The number of decimal places shown for values in the readout. |
| Text: Net GEX (Vol) / Text: Net GEX (OI) | Includes the net Volume or OI GEX figure in the readout. |
| Text: Major + (Vol) / Text: Major - (Vol) | Includes the major positive and negative Volume GEX levels. |
| Text: Zero Gamma | Includes the zero gamma level. |
| Text: Delta Reversal | Includes the delta reversal level. |
| Text: Greek Majors | Includes the major Greek levels, in State mode. |
| Show Values | Displays a "Strike | Value" text directly on the meaningful profile levels, separate from the Status Text panel. |
Colors
| Setting | What it does |
|---|---|
| Positive Color / Negative Color | The bar colors for the main profile's positive and negative side. |
| Major +Vol Color / Major -Vol Color | The line colors for the major Volume GEX levels. |
| Major +OI Color / Major -OI Color | The line colors for the major Open Interest GEX levels. |
| Zero Gamma Color | The line color for the zero gamma flip level. |
| Greek Major + Color / Greek Major - Color | The line colors for the major Greek levels. |
| Long Gamma Color / Short Gamma Color | The line colors for the major long and short gamma levels. |
| Prior Dot 1 (1m) / 2 (5m) / 3 (10m) / 4 (15m) / 5 (30m) | The dot color for each lookback window. |
History Majors
Historical majors look different from the web app
On Quantower, historical majors are drawn as small tick marks for all three lines: call gamma, put gamma, and zero gamma. This is different from the gexbot web app, which renders the same historical data as scattered dots. Both represent the same underlying data, just with a different drawing style suited to each platform.
| Setting | What it does |
|---|---|
| Show History Majors | Fetches and draws the day's historical major levels with one API call. Enable this on only one instance per chart. |
| History: Show Call Gamma ticks / Show Put Gamma ticks / Show Zero Gamma ticks | Toggles each historical line. |
| History: Tick Width (px) / Tick Thickness (px) | The size of the historical tick marks. |
| History: Call Gamma Color / Put Gamma Color / Zero Gamma Color | The colors for the three historical lines. |
| Show Live History | Appends the current live major levels to the historical line in real time, at no extra API cost. |
| Live Tick Width (px, 0=follow History) / Live Tick Thickness (px, 0=follow History) | Overrides the live segment's size independently, or leave at 0 to match the historical settings above. |
| History: Max Ticks Visible (perf) | Caps how many historical ticks are drawn at once, for performance. |
| History: Min Gap Between Ticks (px) | The minimum pixel spacing enforced between historical ticks. |
GexBot Orderflow Live
GexBot Orderflow Live is a separate, companion indicator. It streams a live orderflow feed over WebSocket and plots it as a column histogram in its own chart window, alongside a zero line. It is only available in the standard build, not in the AMP Futures build.
| Setting | What it does |
|---|---|
| API Key | Your gexbot API key. The same key used by the main GexBot indicator works here too. |
| Ticker | The symbol to stream, for example ES_SPX. It must be entered exactly as gexbot expects it. |
| Metric | Which flow to plot: GEX, DEX, or Convexity. |
| DTE | Whether the metric is calculated for options expiring today (0DTE) or the next expiration (1DTE). |
Streams only during NYSE regular trading hours
This indicator only connects and streams data between 9:30 AM and 4:00 PM ET, on trading days. Outside that window, it disconnects and shows a waiting status until the next session opens. It does not backfill history. If you add more than one GexBot Orderflow Live instance with the same API key, they share a single connection automatically.