NinjaTrader integration
Install and configure the official gexbot NinjaScript add-on for NinjaTrader 8.1+.
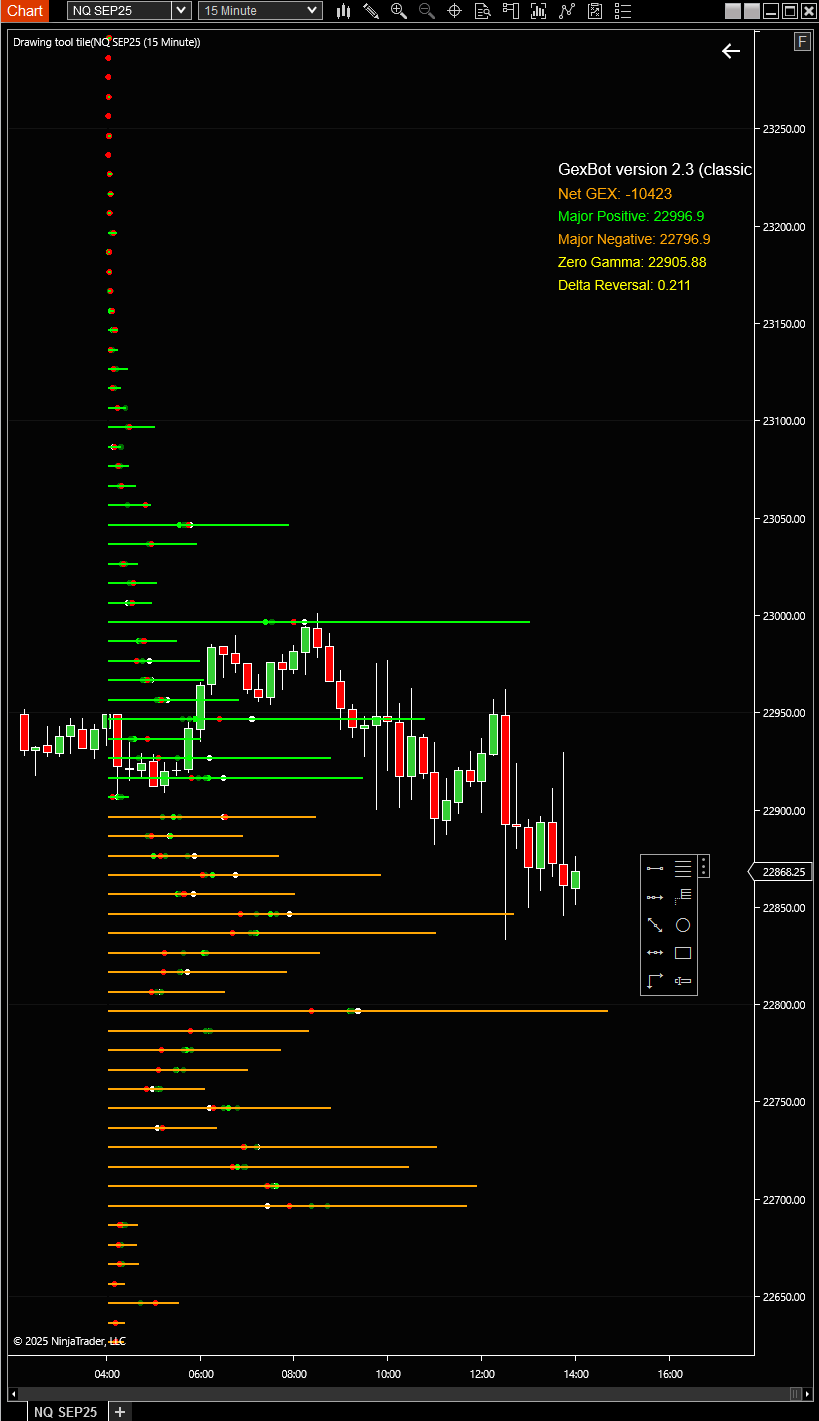
The gexbot NinjaTrader add-on plots real-time GEX ladders, multi-Greek profiles, zero gamma inflection boundaries, and major levels directly on your NinjaTrader 8 chart. The package ships two indicators.
gexbotdraws the GEX and Greek profiles, the major levels, and the historical majors. This is the main indicator, documented below.gexbotOrderflowis a companion indicator that streams sub-second GEX, DEX, and Convexity flow imbalances over WebSocket. It has its own section below.
Requirements
- You need NinjaTrader 8.1 or later, 64-bit. Legacy NinjaTrader 8.0 is deprecated and not supported.
- You need an active gexbot subscription with API access.
- You need your API key. Copy it from Connections.
Download the add-on
You can also find the latest NinjaTrader add-on in the Indicators section on gexbot.com, or on the official gexbot Discord.
Remove the old add-on first
If you already have a previous version installed, remove it before importing the new one. In NinjaTrader 8 Control Center, go to Tools → Remove NinjaScript Add-On..., select the existing gexbot add-on, and remove it. Importing a new version on top of an old one without removing it first can cause assembly conflicts. See the note below.
Import the add-on
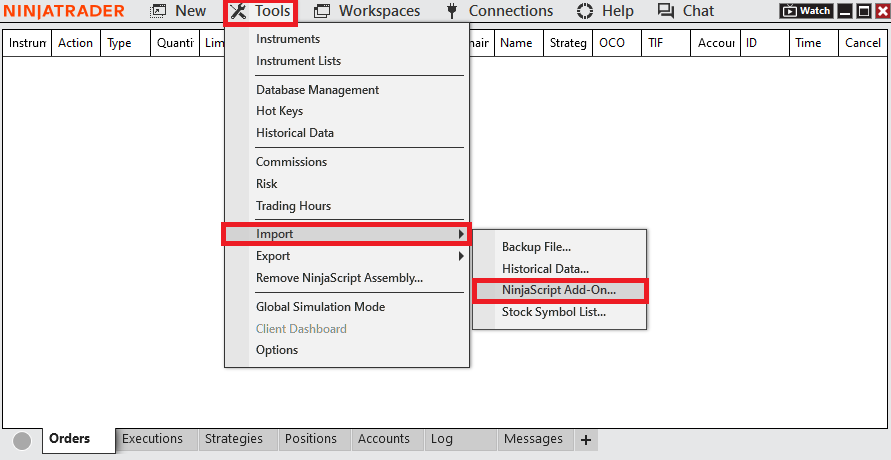
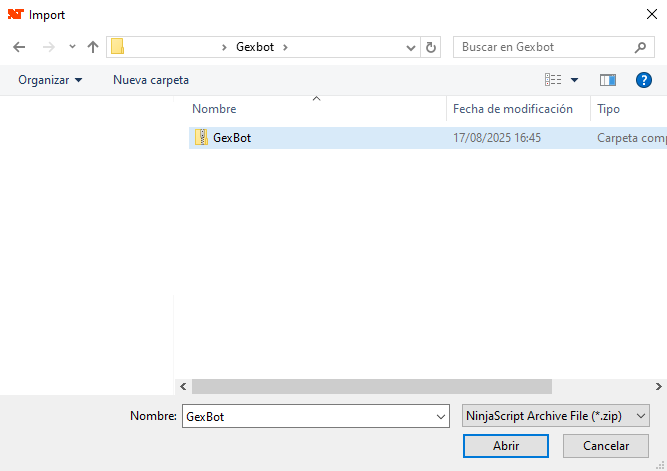
In NinjaTrader 8 Control Center, go to Tools → Import → NinjaScript Add-On... and select the downloaded .zip package.
Add the indicator
Open any chart and press Ctrl+I to open the Indicators window. Locate gexbot, or gexbotOrderflow for the streaming feed, and click Add.
Configure it
In the Properties panel, paste your API Key first. Nothing else works without it. Then continue with the Configuration tab above.
Assembly conflicts on import
If you hit a compile or assembly error right after importing, first make sure you removed the previous gexbot add-on as described above. If the error persists, check the NinjaTrader bin directory for a manually placed Newtonsoft.Json.dll file left over from another add-on or a manual install, and remove it before importing gexbot again. A leftover copy of that file is the most common cause of this error.
Multi-symbol overlay
You can add the gexbot indicator more than once on the same chart to overlay levels from different tickers, for example SPY and QQQ. Each instance keeps its own Symbol, API settings, and display position.
Nothing showing up on your chart?
If the indicator loads but no profile or level appears, see Nothing is showing up on my chart in the FAQ tab above before contacting support.
Every setting below lives in the indicator's Properties panel, grouped into these tabs: General, History Majors, Prior Dots, Colors, Line Styles, Max Change Table, Levels Table, and Profile Filter.
General
Connection & Package
| Setting | What it does |
|---|---|
| Version | Read-only. Shows the installed indicator build, for example version 4.10. Include this when reporting an issue. |
| API Key | Your gexbot API key. Paste it in first. Nothing else works without it. |
| Symbol | The ticker requested from the API, for example SPX. It is independent from the chart's own instrument, so you can show SPX levels on an ES chart, especially when combined with Futures Target below. |
| Subscription Type | Classic combines Volume and Open Interest GEX (Naive GEX). State uses classified orderflow, which unlocks the Greek Type dropdown below. |
| Aggregation Period | zero covers options expiring today (0DTE). full is a 90-day aggregate. one covers the next expiration (1DTE). |
| Greek Type | Only used when Subscription Type is State: gex, or one of delta, gamma, charm, or vanna, each available for 0dte or 1dte. Leave this at gex when Subscription Type is Classic. |
| Classic GEX Source | Only used when Subscription Type is Classic and Greek Type is gex. Draws the profile from Volume or from Open Interest (OI). |
Profile Display
| Setting | What it does |
|---|---|
| GEX Profile Alignment | Left or Right auto-anchors the profile's origin to that edge of the chart. Manual lets you position it yourself with X Position of Profile below. |
| Bar Direction | The direction bars grow from the origin: Left, Right, or Both, where calls extend one way and puts extend the other, forming a split profile. |
| X Position of Profile (Pixel) | The manual horizontal position, only used when GEX Profile Alignment is Manual. |
| GEX Profile Width (% of Chart Window) | The maximum bar length, as a percentage of chart width. |
| Skew Dot Size | The size of the skew dots plotted at each strike. |
| X Position of Skew Dots (% of Chart Width) | The horizontal position of the skew dots. |
| X Position of Status Text | The horizontal pixel position of the on-chart status readout. |
| X Position of Max Change Text (% of Chart Width) | The horizontal position of the Max Change labels. See Show Max Change on Prices below. |
| Major Lines End X (px) | Overrides where horizontal major lines end, in pixels. Leave this at 0 for automatic positioning. Set it manually if lines don't reach the right edge on 4K displays. |
Futures Conversion
| Setting | What it does |
|---|---|
| Futures Target | The target futures contract for automatic price conversion, for example ES, NQ, RTY, or GC, or CL. When set, it fetches the multiplier and additive from the API at startup and overrides the two manual fields below. Leave it empty to disable. |
| Futures Premium (Additive) | A manual additive offset, used only when Futures Target is empty. It is overwritten automatically once a Futures Target is set. |
| Futures Premium (Multiplicative) | A manual multiplier, applied before the additive premium above. It follows the same override behavior. |
Futures conversion cadence
When a Futures Target is set, the conversion refreshes automatically at startup, at 9:30 and 9:32 AM ET, and every 15 minutes after that, and only between 9:30 AM and 4:00 PM ET.
Live data window
This indicator only fetches live GEX and Greek data between 9:30 AM and 11:00 PM ET, and not at all on Saturday or Sunday. Outside this window, including before 9:30 AM, it will not update. Futures conversion specifically follows a tighter window, ending at 4:00 PM ET, as noted above.
Refresh & Overlays
| Setting | What it does |
|---|---|
| Main Refresh (seconds) | How often the live profile and major levels refresh. |
| MaxChange Refresh (seconds) | How often the Max Change text labels refresh, independent from the main refresh. |
| Show Max Change on Prices | Displays the price and size of the largest recent GEX changes as text labels anchored to their strike, green for an increase and red for a decrease. |
| Show Status Text | Toggles the small on-chart status readout: indicator version, Net GEX, major levels, a session line (RTH session US - live GexBot data or ETH session - Levels not in live update -> use 1DTE), and your Subscription level (Classic, State, Orderflow or Quant, read once from your API key). It also shows a red message when the key is missing or rejected. |
| Show Major Positive by Volume / Show Major Negative by Volume | Toggles the major positive and negative Volume GEX lines. |
| Show Zero Gamma | Toggles the zero gamma flip line. |
| Show Major Positive by OI / Show Major Negative by OI | Toggles the major positive and negative Open Interest GEX lines. These are only meaningful when Subscription Type is Classic. |
| Show Major Long Gamma / Show Major Short Gamma | Toggles the major long and short gamma lines. These are only meaningful when Subscription Type is State. |
History Majors
| Setting | What it does |
|---|---|
| Show Historical Levels | Fetches and draws the day's historical major levels with one API call. Enable this on only one gexbot instance per chart, to avoid redundant calls. |
| Show Live History | Appends the current live major levels to the historical line in real time, at no extra API cost. Enable this on only one instance per chart. |
| Historical Call Gamma Color / Historical Put Gamma Color / Historical Zero Gamma Color | The colors for the positive, negative, and zero-gamma historical lines. |
| Dot Width | The thickness of the historical line. |
Prior Dots
These are small dots plotted at each strike, showing how its value has changed over the last few minutes. They give you a quick way to see where GEX or the selected Greek is building up or fading, without waiting for the next refresh.
| Setting | What it does |
|---|---|
| 1 / 5 / 10 / 15 / 30 Min Size | The dot size for each lookback window, meaning how far back that dot's change is measured. |
| 1 / 5 / 10 / 15 / 30 Min Color | The dot color for each lookback window. |
Colors
| Setting | What it does |
|---|---|
| Call GEX Color / Put GEX Color | The bar colors for call (positive) and put (negative) GEX strikes. |
| Long DEX Color / Short DEX Color | The bar colors for the delta profile. |
| Long Gamma Color / Short Gamma Color | The bar colors for the gamma profile. |
| Positive Vanna Color / Negative Vanna Color | The bar colors for the vanna profile. |
| Positive Charm Color / Negative Charm Color | The bar colors for the charm profile. |
| Center Profile Line Color | The color of the vertical line marking the bars' origin. |
| Major Positive by Volume Color / Major Negative by Volume Color | The line colors for the major Volume GEX levels. |
| Zero Gamma Color | The line color for the zero gamma flip level. |
| Major Positive by OI Color / Major Negative by OI Color | The line colors for the major Open Interest GEX levels. |
| Major Long Gamma Color / Major Short Gamma Color | The line colors for the major long and short gamma levels. |
Line Styles
| Setting | What it does |
|---|---|
| Majors Line Width | The thickness of the horizontal major-level lines. |
| GEX/Greeks/Volume Line Width | The thickness of the profile bars and lines. |
| Majors Line Style | The dash style of the major-level lines. |
| GEX/Greeks/Volume Line Style | The dash style of the profile bars and lines. |
Max Change Table
A small table of the strike with the largest GEX change over the last 1, 5, 10, 15 and 30 minutes. Available with the gex Greek only. Off by default.
| Setting | What it does |
|---|---|
| Show Max Change Table | Turns the table on or off. |
| Corner | TopLeft, TopRight, BottomLeft or BottomRight. |
| Offset X (px) / Offset Y (px) | Distance from the chosen corner. |
| Font Size (px) | The size of the table text. |
Values use the same units as the gexbot website: billions (Bn) for SPX, ES_SPX, NDX and NQ_NDX, millions (MM) for every other ticker. Strikes follow your futures conversion.
Levels Table
A table of the key levels in the same layout as the website: Zero Gamma, Major Positive, Major Negative and Net GEX for Volume, plus Major Positive, Major Negative and Net GEX for Open Interest when Subscription Type is Classic. Available with the gex Greek only. Off by default.
| Setting | What it does |
|---|---|
| Show Levels Table | Turns the table on or off. |
| Corner / Offset X (px) / Offset Y (px) / Font Size (px) | Same positioning settings as the Max Change Table. |
| Zero Gamma, Major Positive (Volume), Major Negative (Volume), Net GEX (Volume) | Choose which Volume rows to show. |
| Major Positive (Open Interest), Major Negative (Open Interest), Net GEX (Open Interest) | Choose which Open Interest rows to show. Classic package only. |
Net GEX is shown like on the website: in billions for SPX, ES_SPX, NDX and NQ_NDX, green when positive and red when negative. A level with no value is hidden.
Profile Filter
Keeps only the largest bars of the profile, to declutter the chart. Each setting is a number of bars. 0 shows every bar, which is the default.
| Setting | What it does |
|---|---|
| Volume: N Largest Positive / Negative Bars | Applies to the Volume profile (Classic volume and State GEX). |
| Open Interest: N Largest Positive / Negative Bars | Applies to the Classic Open Interest profile. |
| Greeks: N Largest Positive / Negative Bars | Applies to the State Greek profiles (delta, gamma, charm, vanna). |
The ranking uses the whole profile, not only the part visible on screen. The prior-value dots follow the filter, so the dots of hidden strikes disappear too.
gexbotOrderflow
gexbotOrderflow is a separate, companion indicator. It streams a live orderflow feed over WebSocket rather than polling like the main gexbot indicator, and it does not backfill history. It only updates during the NYSE regular trading session, and shows nothing outside those hours. If you need continuous, always-on orderflow tracking, the gexbot Orderflow page on the web app is the fuller product, built specifically for that use case.